Create Pretty & Animated Donut Charts with jQuery and Chart.js
| File Size: | 3.84 KB |
|---|---|
| Views Total: | 28622 |
| Last Update: | |
| Publish Date: | |
| Official Website: | Go to website |
| License: | MIT |
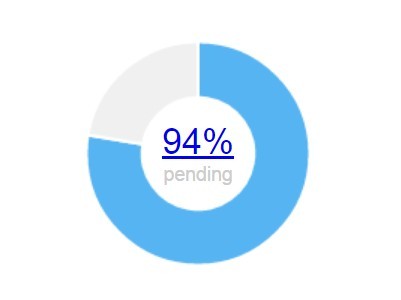
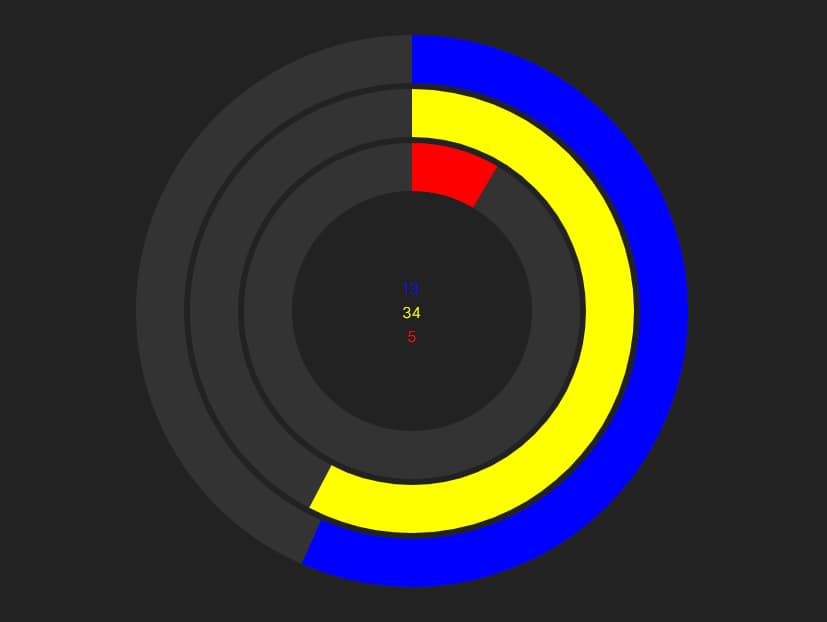
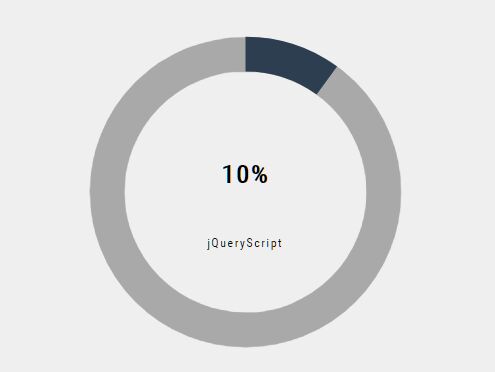
Pretty Doughtnut is a jQuery plugin that makes it easier to draw animated, doughnut chart style, circular progress indicators using Html5 canvas and chart.js JavaScript library.
See also:
- CProgress - jQuery Circular Progress Bar Plugin
- Smooth Circle Chart Plugin with jQuery and CSS3 - Circle Charts
- Animated Circular Progress Bar with jQuery and Canvas - Circle Progress
- Circular Percentage Loader Plugin with jQuery and Canvas - ClassyLoader
- Percentage Loader - jQuery Progress Bar Plugin
- Customizable Circular Progress Bar with jQuery and CSS3 - Circle Diagram
How to use it:
1. Load jQuery library and the jQuery Pretty Doughtnut plugin in the document.
<script src="//ajax.googleapis.com/ajax/libs/jquery/2.1.3/jquery.min.js"></script>
<script src="pretty-doughtnut.js"></script>
2. Load the necessary chart.js for HTML5 based JavaScript charts.
<script src="http://cdnjs.cloudflare.com/ajax/libs/Chart.js/1.0.1/Chart.min.js"></script>
3. Create a container that will serve as the container for your donut charts.
<div id="container"></div>
4. The JavaScript to render sample donut charts within the container.
$(window).load(function() {
  doughnutWidget.options = {
    container: $('#container'),
    width: 100,
    height: 100,
    class: 'myClass',
    cutout: 50
  };

  doughnutWidget.render(data());

  setInterval(init, 2000);
});

function init() {
  doughnutWidget.render(data());
}

function data() {
  var data = {
  pending: {
    val: Math.round(Math.random() * 100),
    color: '#57B4F2',
    click: function(e) {
    console.log('hi');
    }
  },
  delivered: {
    val: Math.round(Math.random() * 100),
    color: '#6DED5C'
  },
  delayed: {
    val: Math.round(Math.random() * 100),
    color: '#E63329',
    link: 'http://www.google.com'
  }
  };

  return data;
}
This awesome jQuery plugin is developed by fixanoid. For more Advanced Usages, please check the demo page or visit the official website.