Create Skill & Experience Graphs with jQuery and Canvas
| File Size: | 2.31 KB |
|---|---|
| Views Total: | 3166 |
| Last Update: | |
| Publish Date: | |
| Official Website: | Go to website |
| License: | MIT |
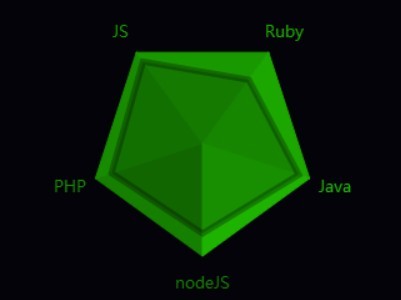
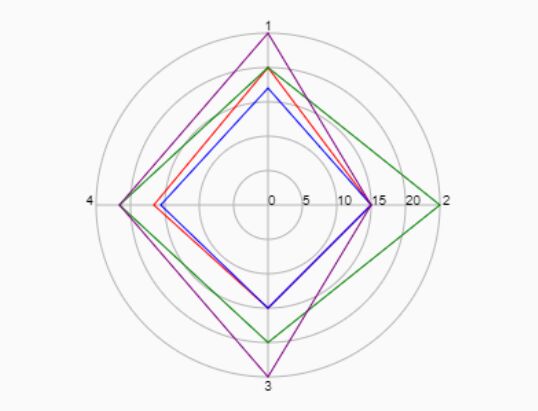
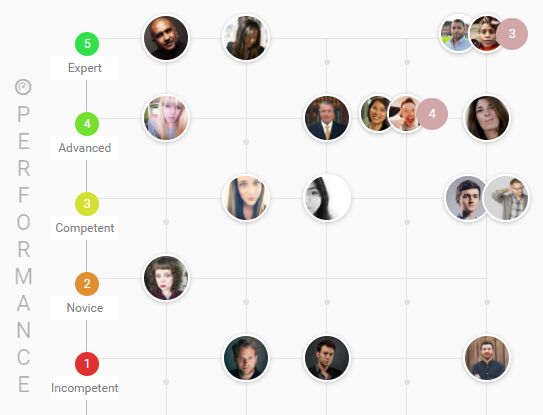
Skill Graphs is a jQuery plugin that makes use of Html5 canvas element to generate radar chart-style graphs for presenting your skills, experiences, interests, abilities.
See also:
How to use it:
1. Create an empty container that the plugin will render graphs using canvas within it.
<div class="content"></div>
2. Load the latest version of jQuery library at the bottom of the page.
<script src="http://ajax.googleapis.com/ajax/libs/jquery/2.1.1/jquery.min.js"></script>
3. Create a JSON object with the information you wish to present.
var skills = [
  {"header" : "INTERESTS",
    "captions" : [
      "Cooking",
      "Web",
      "Mobile",
      "Design",
      "AI"
    ],
    "values" : [
      0.70,
      0.90,
      0.70,
      0.80,
      0.70
    ]
  },
  {"header" : "LANGUAGES",
    "captions" : [
      "nodeJS",
      "PHP",
      "JS",
      "Ruby",
      "Java"
    ],
    "values" : [
      0.80,
      0.85,
      0.90,
      0.70,
      0.90
    ]
  },
  {"header" : "MISC",
    "captions" : [
      "Eclipse",
      "Git",
      "Rails",
      "OpenGL",
      "Linux"
    ],
    "values" : [
      0.85,
      0.85,
      0.75,
      0.60,
      0.80
    ]
  }
];
4. The jQuery script.
var pentagonIndex = 0;
var valueIndex = 0;
var width = 0;
var height = 0;
var radOffset = Math.PI/2
var sides = 5; // Number of sides in the polygon
var theta = 2 * Math.PI/sides; // radians per section

function getXY(i, radius) {
  return {"x": Math.cos(radOffset +theta * i) * radius*width + width/2,
    "y": Math.sin(radOffset +theta * i) * radius*height + height/2};
}

var hue = [];
var hueOffset = 25;

for (var s in skills) {
  $(".content").append('<div class="pentagon" id="interests"><div class="header"></div><canvas class="pentCanvas"/></div>');
  hue[s] = (hueOffset + s * 255/skills.length) % 255;
}

$(".pentagon").each(function(index){
  width = $(this).width();
  height = $(this).height();
  var ctx = $(this).find('canvas')[0].getContext('2d');
  ctx.canvas.width = width;
  ctx.canvas.height = height;
  ctx.font="15px Monospace";
  ctx.textAlign="center";

  /*** LABEL ***/
  color = "hsl("+hue[pentagonIndex]+", 100%, 50%)";
  ctx.fillStyle = color;
  ctx.fillText(skills[pentagonIndex].header, width/2, 15);

  ctx.font="13px Monospace";

  /*** PENTAGON BACKGROUND ***/
  for (var i = 0; i < sides; i++) {
    // For each side, draw two segments: the side, and the radius
    ctx.beginPath();
    xy = getXY(i, 0.3);
    colorJitter = 25 + theta*i*2;
    color = "hsl("+hue[pentagonIndex]+",100%," + colorJitter + "%)";
    ctx.fillStyle = color;
    ctx.strokeStyle = color;
    ctx.moveTo(0.5*width, 0.5*height); //center
    ctx.lineTo(xy.x, xy.y);
    xy = getXY(i+1, 0.3);
    ctx.lineTo(xy.x, xy.y);
    xy = getXY(i, 0.37);
    console.log();
    ctx.fillText(skills[ pentagonIndex].captions[valueIndex],xy.x, xy.y +5);
    valueIndex++;
    ctx.closePath();
    ctx.fill();
    ctx.stroke();
  }

  valueIndex = 0;
  ctx.beginPath();
  ctx.fillStyle = "rgba(0, 0, 0, 0.2)";
  ctx.strokeStyle = "rgba(0, 0, 0, 0.3)";
  ctx.lineWidth = 5;
  var value = skills[pentagonIndex].values[valueIndex];
  xy = getXY(i, value * 0.3);
  ctx.moveTo(xy.x,xy.y);
  /*** SKILL GRAPH ***/
  for (var i = 0; i < sides; i++) {
    xy = getXY(i, value * 0.3);
    ctx.lineTo(xy.x,xy.y);
    valueIndex++;
    value = skills[pentagonIndex].values[valueIndex];
  }
  ctx.closePath();
  ctx.stroke();
  ctx.fill();
  valueIndex = 0;
  pentagonIndex++;
});
5. Set the height and width for the graphs in the CSS.
.pentagon {
  width: 300px;
  height: 300px;
  margin: auto;
  padding: 3px 3px 28px 3px;
  display:inline-block;
}
This awesome jQuery plugin is developed by lopis. For more Advanced Usages, please check the demo page or visit the official website.