Responsive HTML5 Line & Donut Chart Plugin With jQuery - KlondikeChart
| File Size: | 19.6 KB |
|---|---|
| Views Total: | 3529 |
| Last Update: | |
| Publish Date: | |
| Official Website: | Go to website |
| License: | MIT |
KlondikeChart is a lightweight charting plugin for jQuery that makes it easy to represent your data in responsive, customizable, html5 canvas based line and/or donut charts. Requires the jQuery jCanvas plugin that will provide a flexible API for drawing basic and complex shapes. Licensed under the GNU GENERAL PUBLIC LICENSE Version 3.
How to use it:
1. Load the needed jQuery library and jCanvas plugin in the html document.
<script src="/path/to/jquery.min.js"></script>
<script src="/path/to/jcanvas.min.js"></script>
2. Load the jQuery KlondikeChart plugin's files after jQuery library.
<link href="KlondikeChart-MainCss.css" rel="stylesheet">
<script src="KlondikeChart.js"></script>
3. Create an HTML5 canvas element on which you want to draw the line / donut chart.
<canvas id="demo"></canvas>
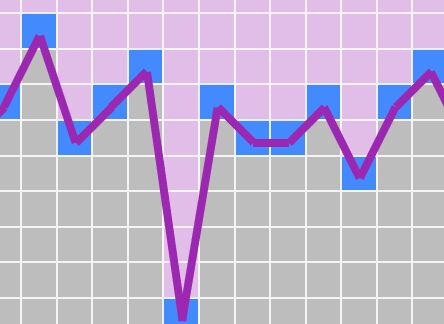
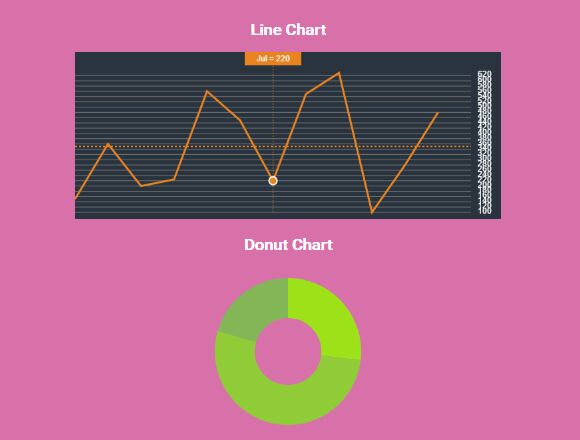
4. The JavaScript to draw a line chart on the canvas element.
// canvas ID
var myLineCanvas = $("#demo");

// color of lines
var lineColor = "#e88320";

// stroke width of lines
var lineStroke = 3;

// background color of Canvas element
var CanvasBackground = "#2a343f";

// color of grid lines
var gridLineColor = "#767676";

// color of grid number
var gridNumeralColor = "#fff";

// interval of the chart graduation grid
var gridLineFrecuency = 20;

// number of decimals
var GridNumeralDecimals = 0;

// drwas the avarage line in the chart
var ChartAvarage = true;

// X values
var XValues = ["Jan", "Feb", "Mar", "Apr", "May", "Jun", "Jul", "Aug", "Sept", "Oct", "Nov", "Dec"];

// Y values
var YValues = [150, 360, 200, 225, 560, 450, 220, 550, 630, 100, 280, 480];

// draws the line chart on the Canvas element
LineChart();
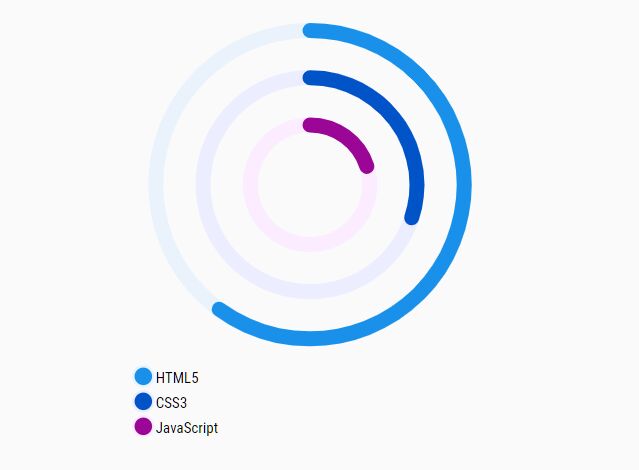
5. The JavaScript to draw a donut chart on the canvas element.
// Canvas ID
var myDonutCanvas = $("#DonutChart")
// donut radius
var DonutRadius = 80;
// donut width
var DonutStroke = 60;
// x-position
var DonutXPosition = 320;
// y-position
var DonutYPosition = 125;
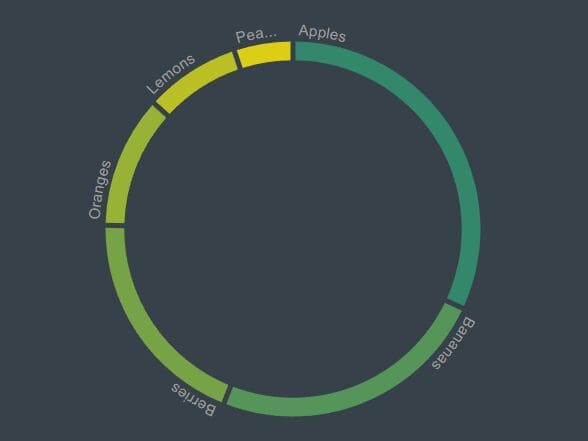
// array of strings displayed in the chart
var statsNames = ["Asia", "Europe", "America"];
// numeric array for the correspondant data to be displayed in the chart
var stats = [1256.54, 2460.20, 956.89];
// draws the donut chart on the Canvas element
DonutChart();
This awesome jQuery plugin is developed by aureliosanchez. For more Advanced Usages, please check the demo page or visit the official website.