Simple Yet Multi-purpose jQuery & Html5 Chart Plugin - czChart
| File Size: | 118 KB |
|---|---|
| Views Total: | 3442 |
| Last Update: | |
| Publish Date: | |
| Official Website: | Go to website |
| License: | MIT |
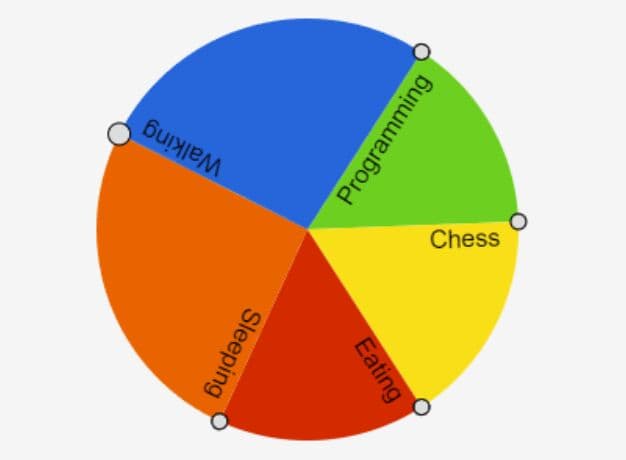
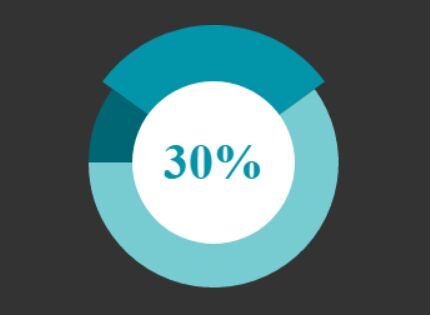
czChart is a simple and cross browser jQuery plugin that allows you to create various types of charts (like bar chart, pie chart, group stack chart, etc) on the web page, based on HTML5 canvas element.
Basic Usage:
1. Include the jQuery javascript library and jQuery czChart's files in the page.
<link type="text/css" href="css/czchart.css" rel="stylesheet"/>
<script src="http://ajax.googleapis.com/ajax/libs/jquery/1.10.2/jquery.min.js"></script>
<script type="text/javascript" src="js/czGraphic.js"></script>
<script type="text/javascript" src="js/czchart.js"></script>
<script type="text/javascript" src="js/czPieChart.js"></script>
<script type="text/javascript" src="js/czBarChart.js"></script>
2. Include the excanvas.js for the support of 2D command-based drawing in internet explorer.
<script type="text/javascript" src="js/excanvas.js"></script>
3. Create a container for your chart.
<div id="barchart"></div>
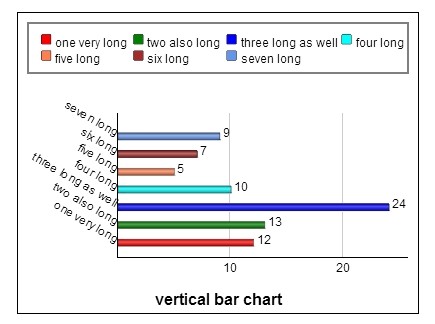
4. Draw a basic vertical bar chart in the javascript.
<script type="text/javascript">
$("#barchart1").czChart({
data:[12,13,24,10,5,7,9],
type:'hBar', // type of chart will be render when user call. Array of all types that the plugin able to handle. 'vBar','vBar', 'hBar', 'vGroupBar', 'hGroupBar', 'vStackBar', 'hStackBar', 'vGroupStackBar', 'hGroupStackBar'
title: {
label:"vertical bar chart",
position:"bottom"
},
dataLabels:["one very long","two also long","three long as well","four long","five long","six long","seven long"],
labelAngle:-30,
xPadding:10,
axes: {
padding:20,//space between the left most bar and the edge of the chart.
xAxis: {
show:true,
showGrid:true,
label:"xAxis"
},
yAxis: {
show:true,
showGrid:true,
label:"yAxis"
},
y2Axis:{
show:false,
showGrid:true,
label:"y2Axis"
}
},
legend: {
showLegend: true,
direction: "horizontal",
location: "n",
maxColumns: 4
}
});
</script>
Change log:
2014-07-04
- When binding to an event such as mouseover, mousemove, etc the mousePos object within the event object will now contain the clientX, clientY and screenX, screenY in addition to left and top which represent pageX and pageY respectively.
2014-06-26
- Added fixChartPosition method in case the user renders multiple charts at the same time and they get displaced due to static positioning.
- Also fixed issue where mouseout event was not correctly triggering on chart if the mouse was move off the chart before to quickly.
2014-06-24
- Modified CzChart to move the chart on window resize
- Fix canvas position when canvas position changed.
This awesome jQuery plugin is developed by cenzic. For more Advanced Usages, please check the demo page or visit the official website.