jQuery Plugin For Making Interactive Charts And Maps - FusionCharts
| File Size: | 1.05 MB |
|---|---|
| Views Total: | 11229 |
| Last Update: | |
| Publish Date: | |
| Official Website: | Go to website |
| License: | MIT |
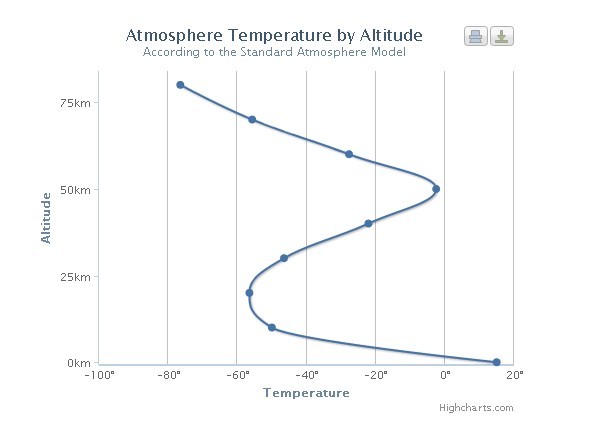
FusionCharts is a jQuery plugin for adding interactive charts and maps to your website. All the features of FusionCharts like events, methods, annotations etc. are accessible through it. You can use it for free along with FusionCharts' free personal license.
Features:
- Render charts from data contained in HTML tables.
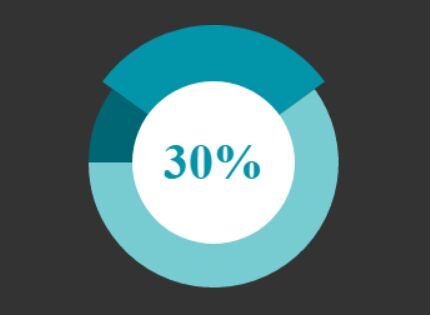
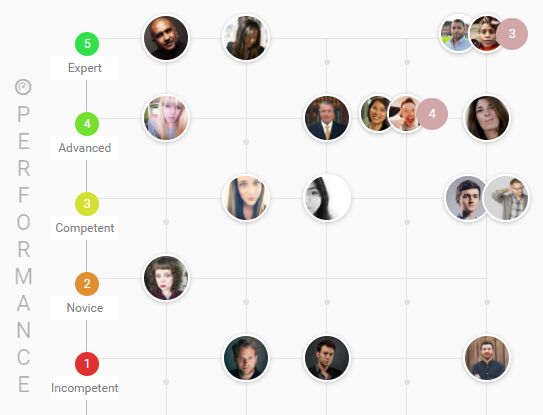
- Make 90+ charts, widgets, gauges and maps.
- Customize the look and feel of all elements on the chart.
- Works seamlessly across PCs (including IE6/7/8), Macs, iPads, iPhones, and Android devices.
- Easy to update chart type, data, and individual cosmetic properties at run-time.
- Insert, prepend, and append multiple charts in an existing chart container.
Basic usage:
1. Load jQuery library together with the fusioncharts.js and fusioncharts.jqueryplugin.js into your code.
<script src="jquery.min.js"></script>
<script src="fusioncharts.js"></script>
<script src="fusioncharts.jqueryplugin.js"></script>
2. Create a container where you want to render a fusion chart.
<div id="chart-container">
  FusionCharts will render here
</div>
3. The JavaScript to render a basic bar chart inside the container you just created.
$("#chart-container").insertFusionCharts({
  type: "column2d",
  dataFormat: "json",
  dataSource: {
      chart: {
          caption: "Harry's SuperMart",
          subCaption: "Top 5 stores in last month by revenue",
          numberPrefix: "$",
          theme: "ocean"
      },
      data: [{
          label: "Bakersfield Central",
          value: "880000"
      }, {
          label: "Garden Groove harbour",
          value: "730000"
      }, {
          label: "Los Angeles Topanga",
          value: "590000"
      }, {
          label: "Compton-Rancho Dom",
          value: "520000"
      }, {
          label: "Daly City Serramonte",
          value: "330000"
      }]
  }
});
4. The JavaScript to render a fusion chart at the end of selected HTML elements.
$("#chart-container").appendFusionCharts({
  ...
});
5. The JavaScript to render a fusion chart at the beginning of selected HTML elements.
$("#chart-container").prependFuionCharts({
  ...
});
Changelog:
2019-12-05
- v1.2.1
2019-01-30
- v1.2.0
2018-12-03
- v1.1.2
2018-09-15
- v1.1.1
About Author:
Author: Rohit Boggarapu
Website: http://www.fusioncharts.com/jquery-charts/
This awesome jQuery plugin is developed by fusioncharts. For more Advanced Usages, please check the demo page or visit the official website.