jQuery Plugin To Convert Tabular Data Into Donut Charts - Chart.js
| File Size: | 27.9 KB |
|---|---|
| Views Total: | 9488 |
| Last Update: | |
| Publish Date: | |
| Official Website: | Go to website |
| License: | MIT |
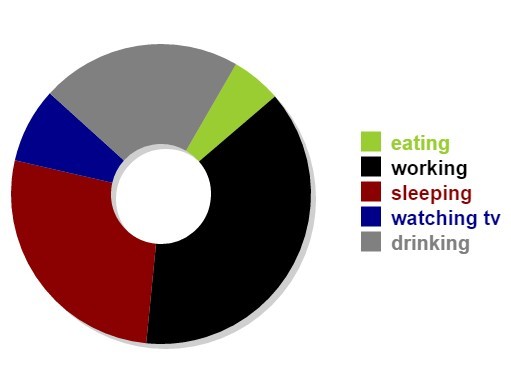
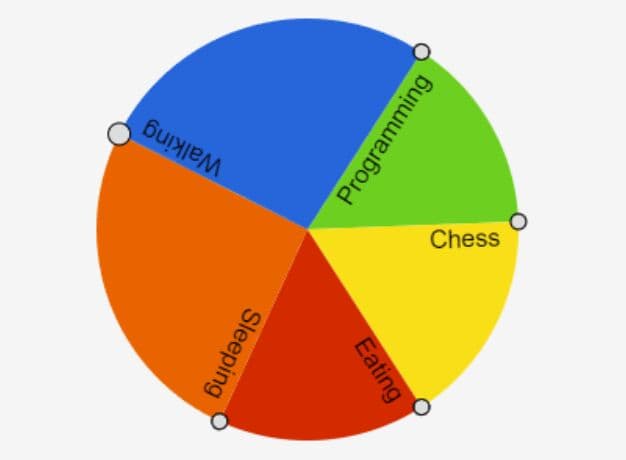
Chart.js is a lightweight jQuery plugin used to render an HTML5 canvas based doughnut chart to present tabular data with chart legends and labels support.
Basic usage:
1. Include the latest version of jQuery library and the jQuery chart.js plugin on the html page.
<script src="https://code.jquery.com/jquery-1.11.3.min.js"></script>
<script src="js/jquery.chart.js"></script>
2. Call the plugin on the table element to render a basic doughnut chart.
$("table").donutChart()
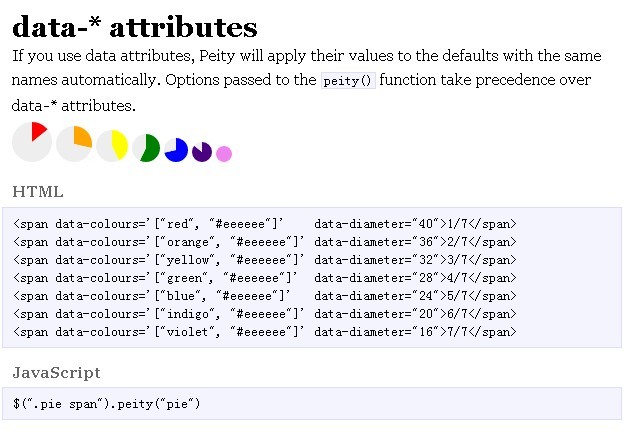
3. Available options to customize your doughnut chart.
$("table").donutChart({
  width: 300,
  height: 200,
  legendSizePadding: 0.05,
  label: "Graph {0}",
  hasBorder: true
})
Change log:
2016-06-08
- Changed default chart size
This awesome jQuery plugin is developed by akumagamo. For more Advanced Usages, please check the demo page or visit the official website.