jQuery Plugin To Convert Tabular Data Into Progress Bars - Progressbarify
| File Size: | 3.43 KB |
|---|---|
| Views Total: | 2461 |
| Last Update: | |
| Publish Date: | |
| Official Website: | Go to website |
| License: | MIT |
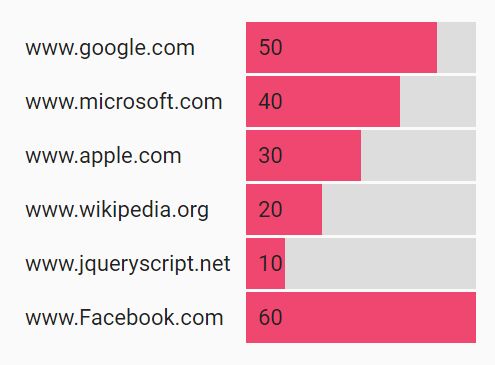
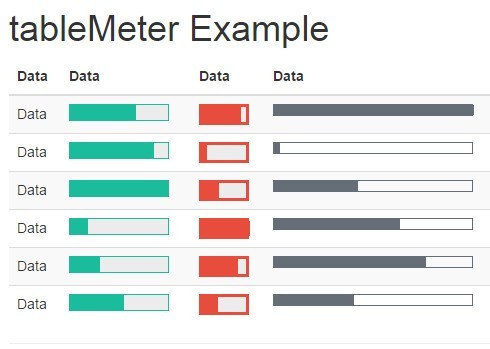
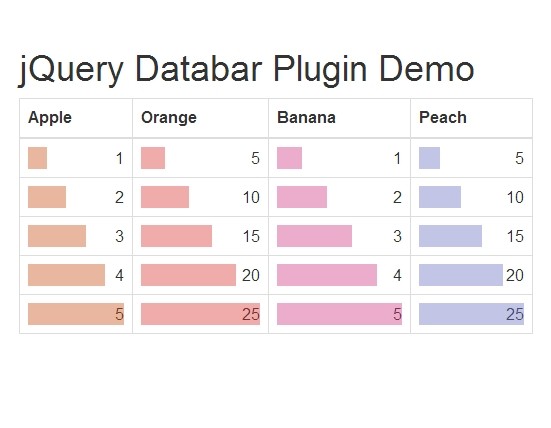
Progressbarify is a lightweight jQuery plugin to visualize your tabular data that automatically converts numeric values within table cells into Excel Data Bar style progress bars.
How to use it:
1. Load the jQuery Progressbarify plugin's script after jQuery library and we're ready to go.
<script src="//code.jquery.com/jquery-3.1.0.slim.min.js"></script>
<script src="table-progressbarify.js"></script>
2. Specify the target table column you want to visualize using the 'data-progressbarify' attribute as follow:
<table data-progressbarify="1">
  <tbody>
    <tr>
      <td>www.google.com</td>
      <td>50</td>
    </tr>
    <tr>
      <td>www.microsoft.com</td>
      <td>40</td>
    </tr>
    <tr>
      <td>www.apple.com</td>
      <td>30</td>
    </tr>
    <tr>
      <td>www.wikipedia.org</td>
      <td>20</td>
    </tr>
    <tr>
      <td>www.jqueryscript.net</td>
      <td>10</td>
    </tr>
  </tbody>
</table>
3. Initialize the plugin and done.
$('[data-progressbarify]').progressbarify();
4. Specify the background & foreground color of the progress bar.
$('[data-progressbarify]').progressbarify({
  primaryColour:   '#31b0d5',
  secondaryColour: 'transparent'
});
Change log:
2016-11-05
- Fix bug causing table variable not being accessible inside the parse args function.
2016-09-20
- Fix bugs by explicitly parsing numbers.
This awesome jQuery plugin is developed by robfarr. For more Advanced Usages, please check the demo page or visit the official website.