jQuery Chart & Graph Plugins
Download Free jQuery Pie Chart, Bar Chart, Donut Chart, Line Chart and other data visualization tools & plugins at our jQuery Chart & Graph Section. Page 1 .
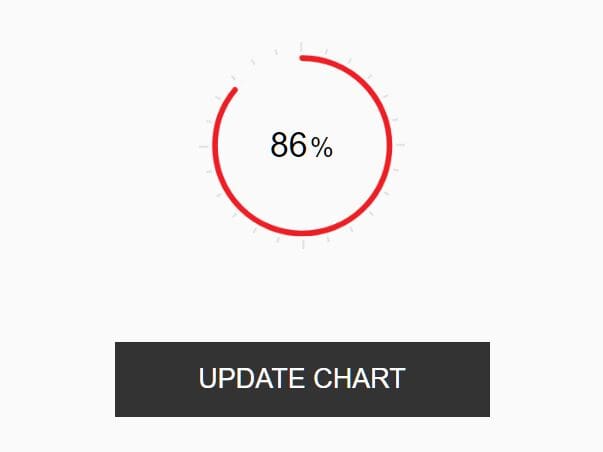
Customizable Pie Chart/Round Progress Bar Plugin - easy-pie-chart
- Chart & Graph - 17905 Viewseasy-pie-chart is a lightweight JavaScript/jQuery plugin to draw animated, customizable, retina-ready pie/ring charts and circular progress bars using HTML5 Canvas and requestAnimationFrame API.

Github-like Interactive Data Heatmaps using jQuery - Heatmap.js
- Chart & Graph - 630 ViewsTransform your time-series data into interactive calendar heatmaps with this jQuery plugin. Perfect for visualizing user activity, contributions, and temporal patterns.
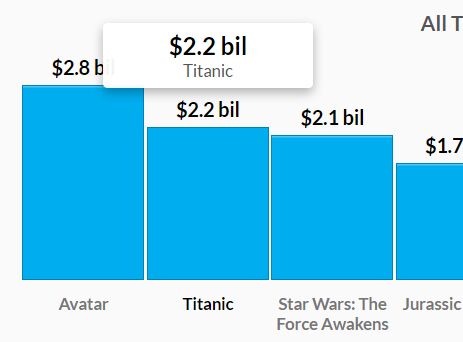
Tiny Animated Chart Plugin For jQuery - simple-chart
- Chart & Graph - 7643 ViewsA simple, lightweight, dynamic, responsive, flexible, animated and cross-browser jQuery chart plugin that currently supports 5 chart types: progress, bar, waterfall, step and column.
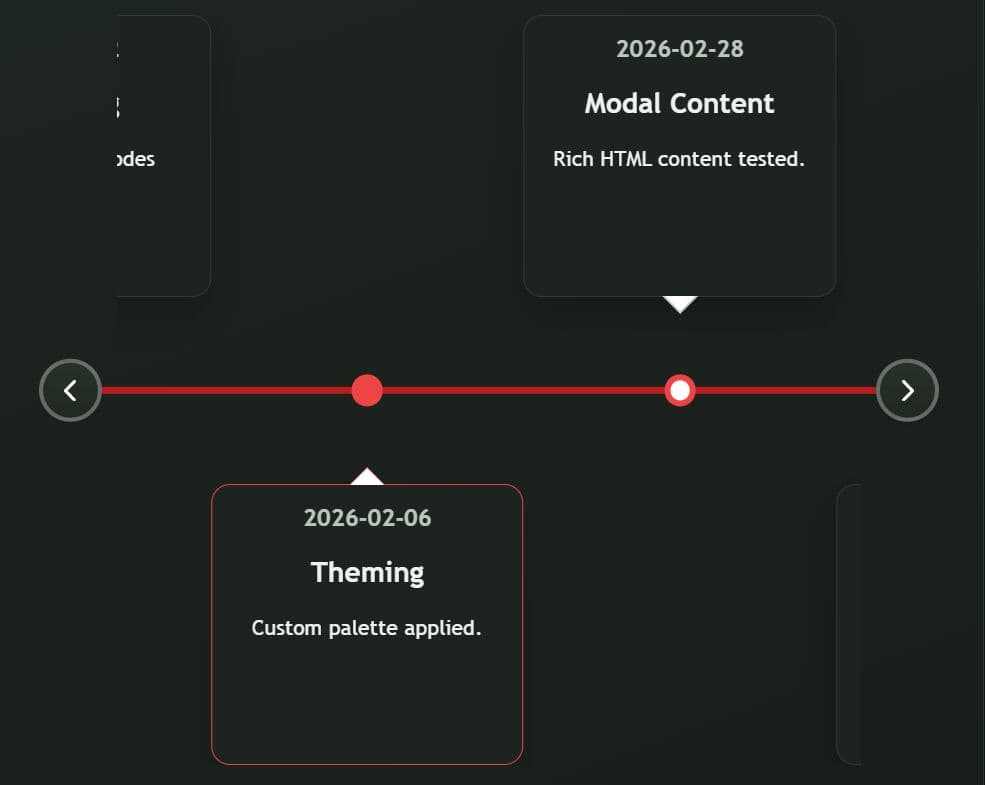
Responsive Timeline Plugin with Horizontal & Vertical Layouts - Vantl
- Chart & Graph - 224 ViewsA JavaScript/jQuery timeline plugin with JSON loading, deep linking, modal content, and responsive horizontal or vertical layouts.
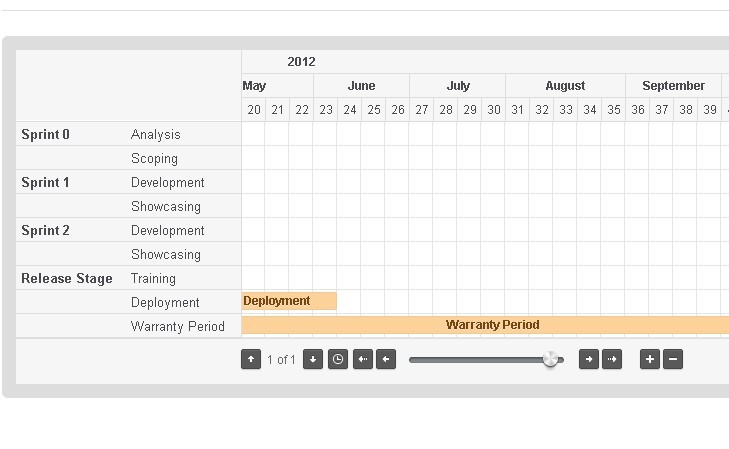
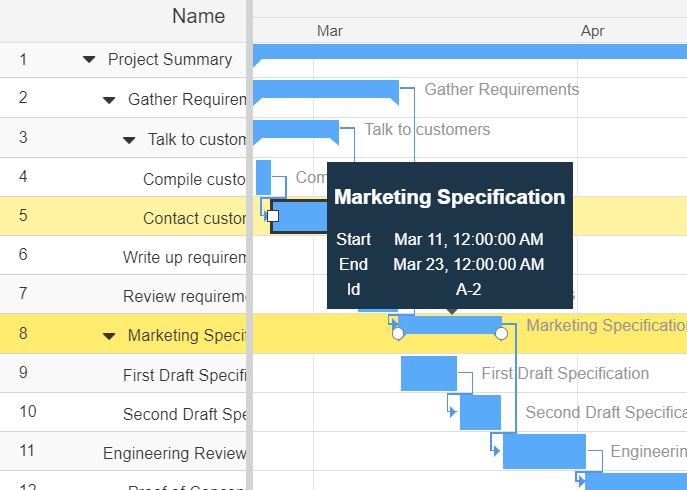
Simple Dynamic Gantt Chart Plugin With jQuery - Gantt Chart
- Chart & Graph - 50096 ViewsGantt Chart is a Simple jQuery Chart Plugin that implements gantt functionality as a jQuery component.
jQuery Small Inline Chart Plugin - Sparklines
- Chart & Graph - 10153 ViewsSparklines is a jQuery plugin that enables you to create a number of different types of Small Inline Charts with just one line of HTML or javascript.

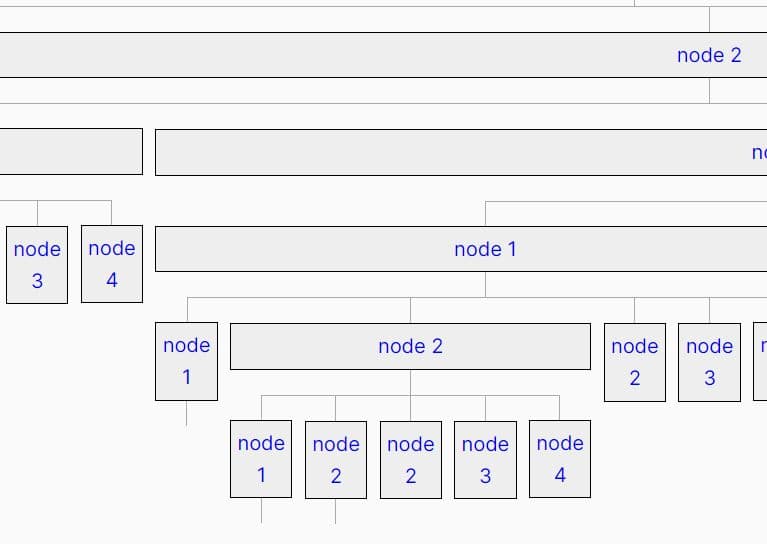
Fully Customizable Organisational Chart Plugin With jQuery - OrgChart
- Chart & Graph - 141458 ViewsOrgChart is a simple, flexible and highly customizable organization chart plugin for presenting the structure of your organization in an elegant way.
Fully Featured Gantt Chart Component By IBM
- Chart & Graph - 18684 ViewsA JavaScript library that provides an easy way to implement a customizable, professional, full featured online gantt chart generator for scheduling your tasks on your modern web app.
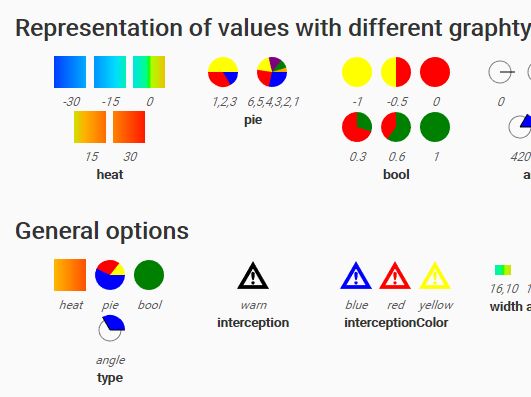
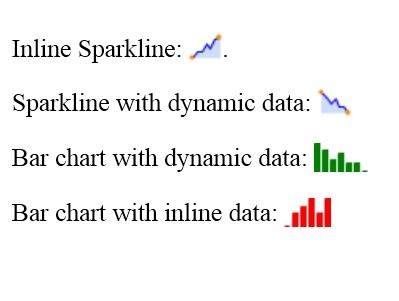
Sparkline (Inline Chart) Plugin With jQuery And SVG - inlineGraph
- Chart & Graph - 4191 ViewsinlineGraph is a lightweight and simple-to-use jQuery plugin used for generating SVG based inline graphs and charts (aka. sparklines) to present your data as heatmap, pie, boolean and angle.

Customizable & Animated jQuery / HTML5 Gauge Meter Plugin
- Chart & Graph - 73083 ViewsGaugeMeter.js is a versatile jQuery gauge plugin which takes advantage of HTML5 canvas to render animated gauge meters and dials with plenty of customization options.
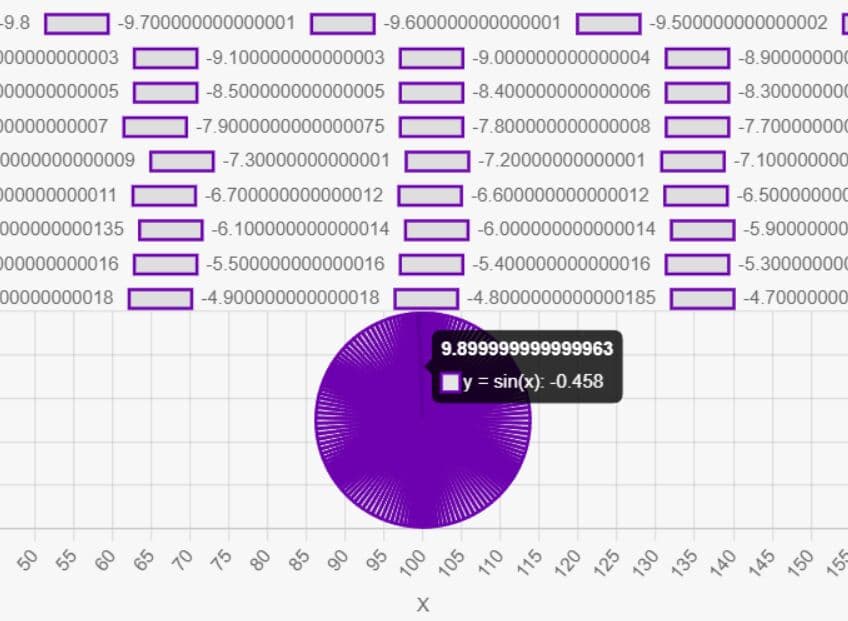
Visualize Mathematical Equations As Graphs - IntrepidGraph
- Chart & Graph - 432 ViewsA jQuery-powered mathematical graphing calculator to graph various mathematical equations including sin, cos, tan, sqrt, log, exp, pi, e, and more.
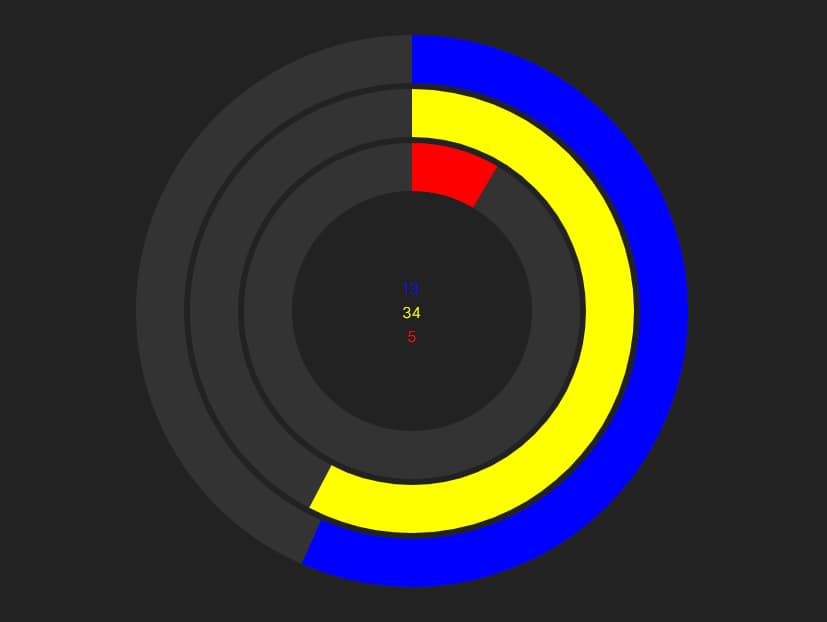
Create Circular Progress Bars And Clocks With jQueryUI-progress-rings
- Chart & Graph - 601 ViewsA jQuery UI widget that helps developers create a single ring or multiple rings to represent data, loading processes, or time.

Customizable Flight Instruments For The Web - jQuery Flight Indicators
- Chart & Graph - 934 ViewsA jQuery plugin that helps create highly customizable attitude, heading, vertical speed, air speed and altimeter indicators on the webpage.
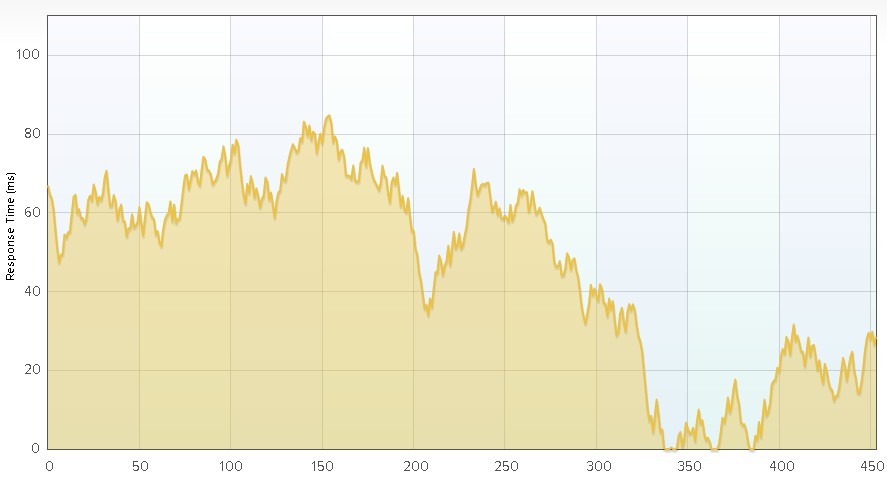
Attractive Plotting Plugin with jQuery - Flot
- Chart & Graph - 9685 ViewsFlot is a JavaScript plotting library works with jQuery for creating attractive looks and interactive Charts or Graphs.
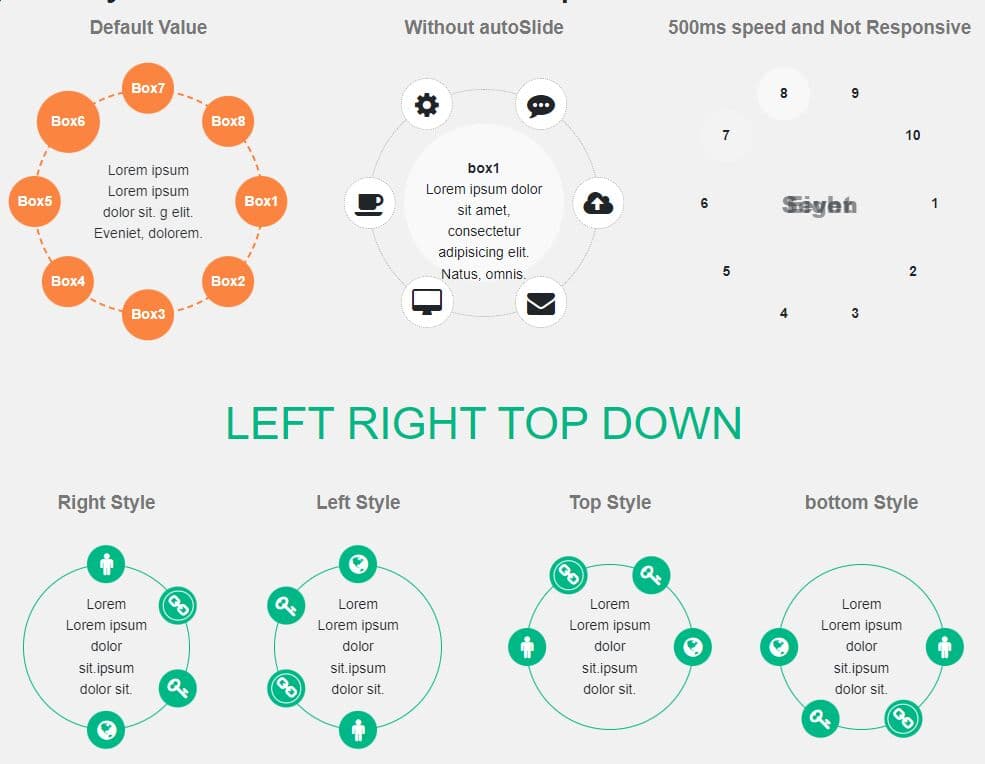
Responsive Circle Infographic Plugin - jQuery Circle Info Box
- Chart & Graph - 2719 ViewsA jQuery plugin to generate animated, responsive, customizable circle infographics on the webpage.
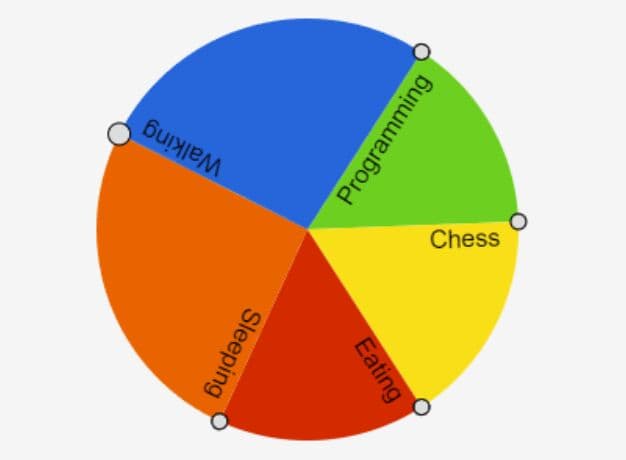
Touch-enable Draggable Pie Chart Generator In JavaScript/jQuery
- Chart & Graph - 1575 ViewsA JavaScript/jQuery plugin that helps developers generate a draggable, interactive, mobile-friendly pie chart using HTML5 canvas.
Visualize JSON Data Into Folder/Organization Trees - jQuery vTree
- Chart & Graph - 3604 ViewsA jQuery plugin designed to visualize JSON data into expandable and collapsible tree structures, such as folder directories, family trees, or organization hierarchies.
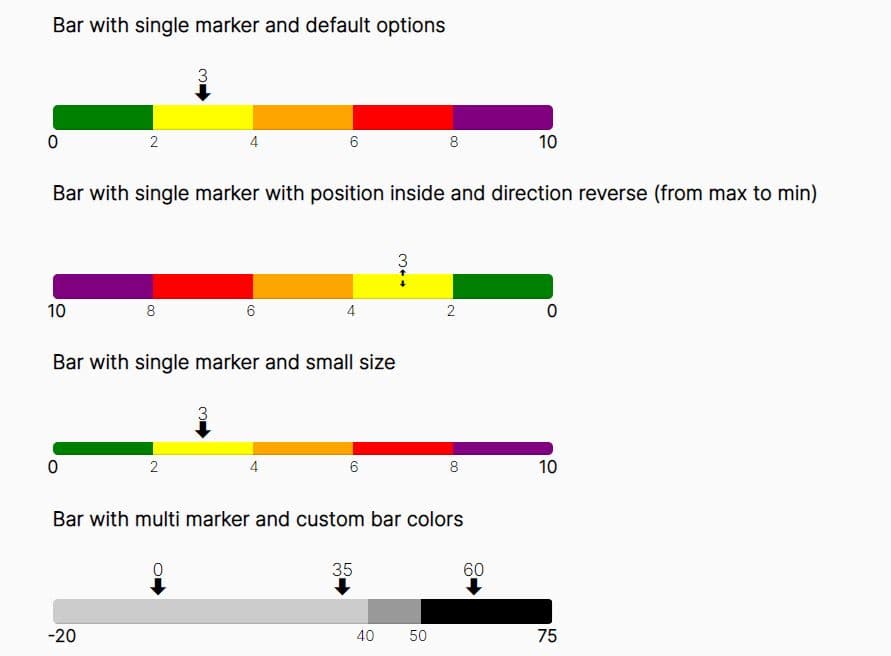
Multicolor Progress Bar Plugin - jQuery Multibar.js
- Chart & Graph - 1571 ViewsA jQuery plugin for creating multi-colored (segmented) progress bars to represent various data ranges, completion levels, or any other metric that requires visualization.
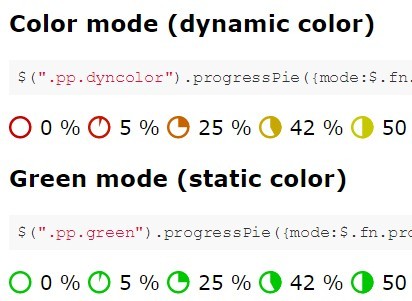
Dynamic Pie Chart-style Progress Bar with jQuery and SVG - progresspieSVG
- Chart & Graph - 16393 ViewsprogresspieSVG is a simple yet robust jQuery plugin which renders pie or ring chart style progress bars or countdown timers using SVG element.

Canvas-based Gantt Chart Plugin - jQuery simpleGantt.js
- Chart & Graph - 2245 ViewsA lightweight and open-source jQuery plugin that helps developers generate simple, customizable, and HTML5 canvas based Gantt Charts on the page.