Animated Donut/Pie/Ring Charts With jQuery And SVG - Donutty
| File Size: | 174 KB |
|---|---|
| Views Total: | 16405 |
| Last Update: | |
| Publish Date: | |
| Official Website: | Go to website |
| License: | MIT |
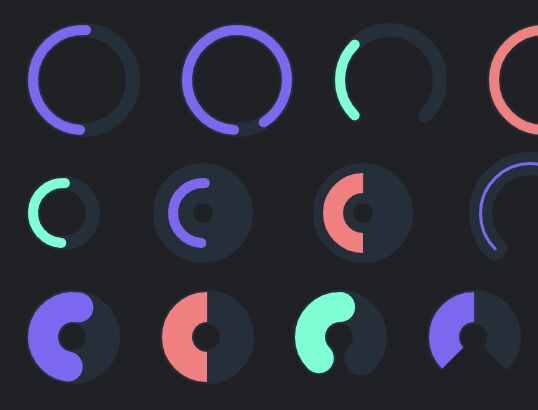
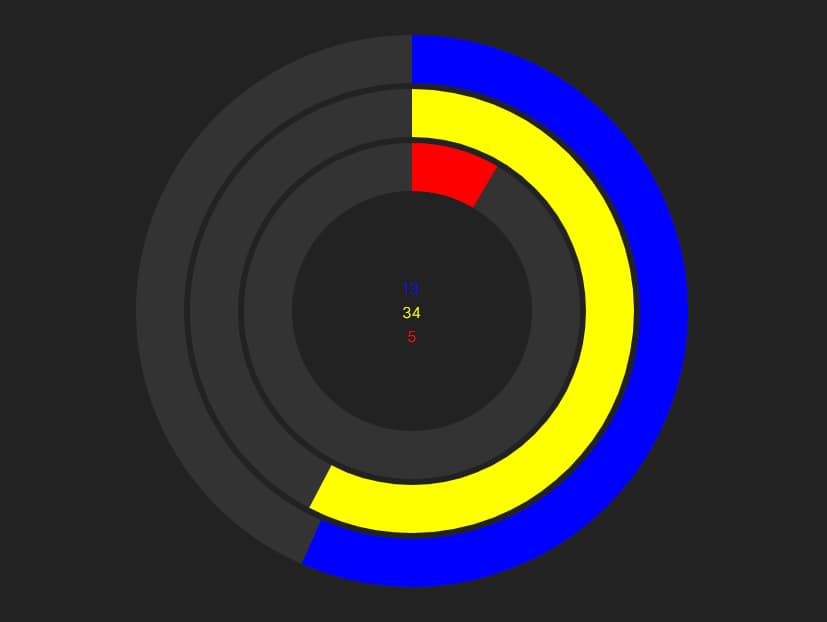
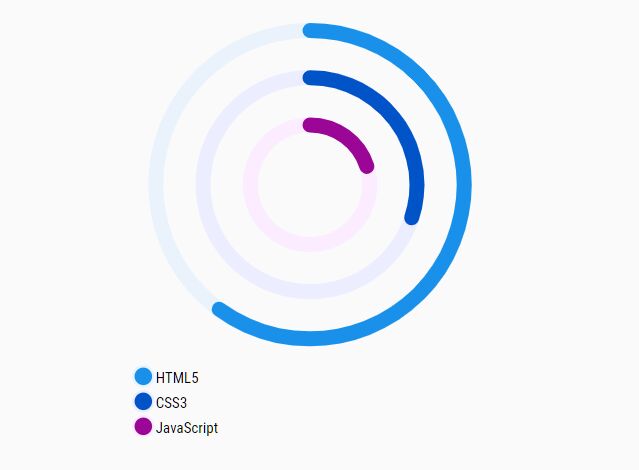
Donutty is a JavaScript/jQuery charting library which lets you generate smoothly animated, fully scalable Donut/Pie/Ring Charts or Circular/Radial progressbars using SVG and CSS3 animations.
Also comes with a vanilla JavaScript version which allows you to implement the charting library without any 3rd dependencies.
See Also:
Install & download:
# Yarn
$ yarn add donutty

# NPM
$ npm install donutty --save
How to use it (jQuery Version):
1. Load the latest jQuery (slim build) and the JavaScript file 'donutty-jquery.js' in the document.
<script src="jquery.slim.min.js"></script>
<script src="dist/donutty-jquery.js"></script>
2. To create a default chart, just add the 'data-donutty' attribute to the placeholder element and done.
<div data-donutty></div>
3. Or call the function on the placeholder element:
const myChart = $("#example").donutty({
      // options here
});
4. Customize the chart via data-OPTION attributes or by passing the options to the donutty() method as follows:
<div data-donutty
     data-radius=20
     data-thickness=40
     data-padding=0
     data-round=false
     data-color="lightcoral"
     data-value=80
     ...>
</div>
// or
const myChart = $("#example").donutty({
      min: -100,
      max: 100,
      value: 50
});
5. All default configuration options.
const myChart = $("#example").donutty({

      // min/max values
      min: 0,
      max: 100,

      // current value
      value: 50,

      // rounded edges or not
      round: true,

      // complete circle or not
      circle: true,

      // padding in pixels
      padding: 4,

      // radius in pixels
      radius: 50,

      // thickness in pixels
      thickness: 10,

      // background color
      bg: "rgba(70, 130, 180, 0.15)",

      // bar color
      color: "mediumslateblue",

      // transition effect
      transition: "all 1.2s cubic-bezier(0.57, 0.13, 0.18, 0.98)",

      // a String that can accept "rtl" for right-to-left modes
      dir: false,

      // or "bottom"
      // start the Donut's filling from the Top instead of always from the Bottom.
      anchor: "top",

});
6. Customize the text, title, description displayed in the chart.
const myChart = $("#example").donutty({

      text: function( state ) {
        return ( state.value / ( state.max - state.min ) * 100 ) + "%";
        // return the percentage of the donut
      },

      title: function() {
        return "Donut Chart Graphic";
      },

      desc: function( v ) {
        return "A donut chart ranging from " + v.min + " to " + v.max + " with a current value of " + v.value + ".";
      };

});
7. Update the options/values/stats of the chart.
// min, max, value
myChart.set( "value", 60 )

// min, max, value, bg, color, etc
myChart.setState({
  options here
})
Changelog:
v2.4.0 (2022-10-19)
- Now have the ability to start the Donut's filling from the Top instead of always from the Bottom.
v2.3.1 (2021-12-08)
- fixing rotate safari bug
v2.2.0 (2021-01-31)
- add accessibility support
v2.0.0 (2019-11-04)
- Fix responsiveness, classList, bump packages
v1.2.3 (2019-06-28)
- Fix width/height on Firefox
v1.2.2 (2019-06-26)
- code refactor
v1.2.1 (2019-06-10)
- No longer throws error about styling an non-existing text element.
This awesome jQuery plugin is developed by simeydotme. For more Advanced Usages, please check the demo page or visit the official website.