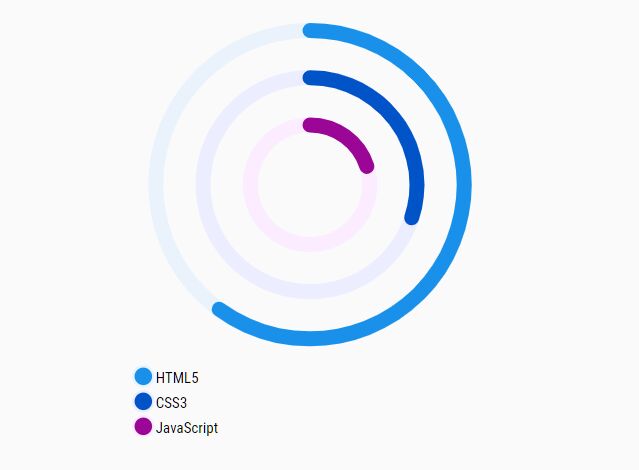
Animated Ring(Donut) Chart Plugin With jQuery And D3.js
| File Size: | 12.2 KB |
|---|---|
| Views Total: | 1513 |
| Last Update: | |
| Publish Date: | |
| Official Website: | Go to website |
| License: | MIT |
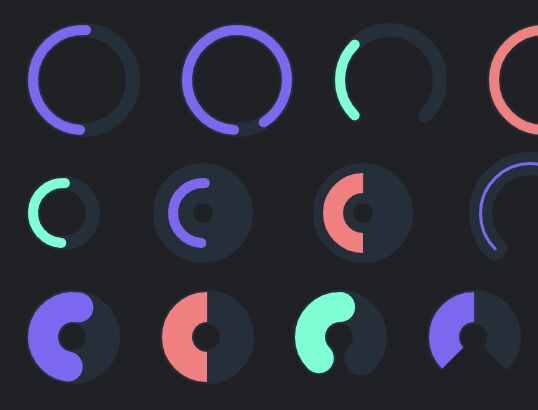
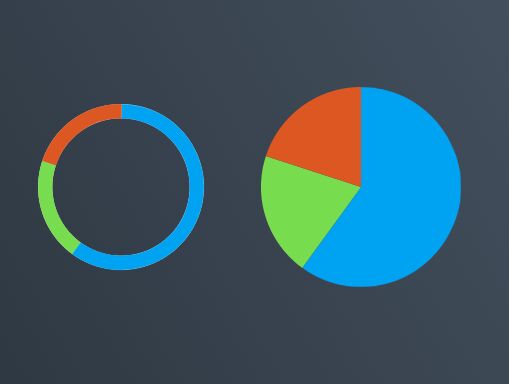
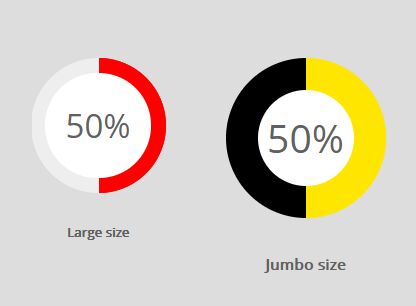
We've all seen donut charts before. They're a great way to visualize data in a circular format.
In this article, we'll show you how to create an animated donut chart (also called ring chart) using the donutgraph.js jQuery plugin.
This plugin is simple to use and built on top of jQuery and D3.js. It adds a fun, interactive element to your charts that will keep users engaged.
We'll also share some tips on how to make your donut chart look more professional.
So, if you're looking for a cool way to jazz up your data visualization projects, be sure to check out this article!
How to use it:
1. Load the needed jQuery library and d3.js libraries in the document.
<script src="/path/to/cdn/jquery.min.js"></script>
<script src="/path/to/cdn/d3.min.js"></script>
2. Load the jQuery donutgraph.js plugin after jQuery.
<script src="plugin.min.js"></script>
3. Create an empty DIV container to hold the donut chart.
<div id="graph"></div>
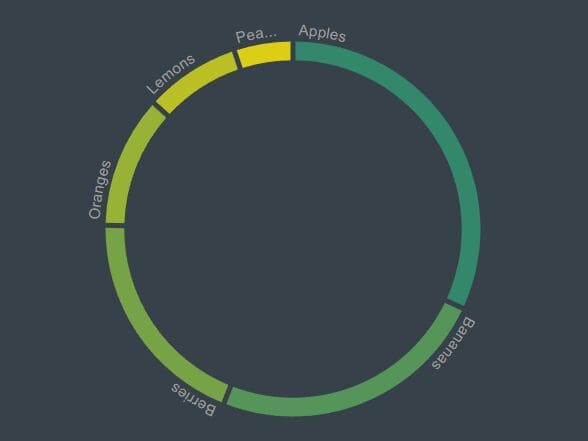
4. Prepare your data to be presented in the donut chart.
var sampleData = [
    {
      id: 1,
      label: "jQuery",
      value: 13.5,
      color: "#80c441"
    },
    {
      id: 2,
      label: "Script",
      value: 13.5,
      color: "#80c441"
    },
    {
      id: 3,
      label: "Net",
      value: 13.5,
      color: "#80c441"
    }
    // ...
]
5. Call the function to generate a default donut chart.
$("#graph").donutgraph({
  data: sampleData
});
6. These are all the available settings that can be called together with the donutgraph plugin.
$("#graph").donutgraph({

  // wrapper element
  container: "#graph",

  // container element (span) for measuring label text
  measureElement: "#measure",

  // width & height of the donut chart
  width: 400,
  height: 400,

  // ring width
  donutWidth: 20,

  // space angle between ring segments
  padAngle: 0.02,

  // duration of the animation
  animationDuration: 750,

  // label color
  labelColor: "#9e9e9e",

  // an array of colors
  accentColor: ["#d81b60","#80c441"],

  // an array of colors used for ring segments
  colorSetting: ["#33876b","#559559","#77a347","#98b236","#bac024","#dcce12","#e0e0e0"],

  // use color range as setted in colorSetting
  useColorRange: true

});
7. Update the data manually.
$("#graph").donutgraph("update", newData);
8. Execute a function when data changes.
$("#graph").donutgraph({
  onChange: function(obj) {
    console.log(obj);
    labelsOnUpdate(obj);
  }
});
This awesome jQuery plugin is developed by jpweinerdev. For more Advanced Usages, please check the demo page or visit the official website.