Create An Editable Organization Chart with jQuery orgChart Plugin
| File Size: | 41.8 KB |
|---|---|
| Views Total: | 88321 |
| Last Update: | |
| Publish Date: | |
| Official Website: | Go to website |
| License: | MIT |
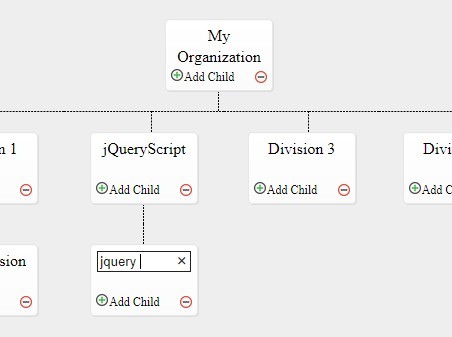
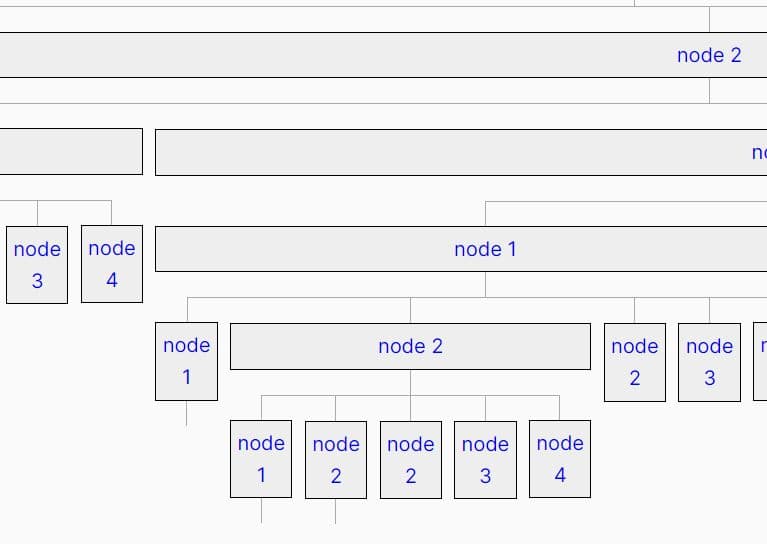
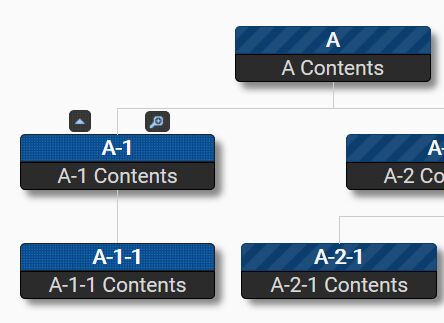
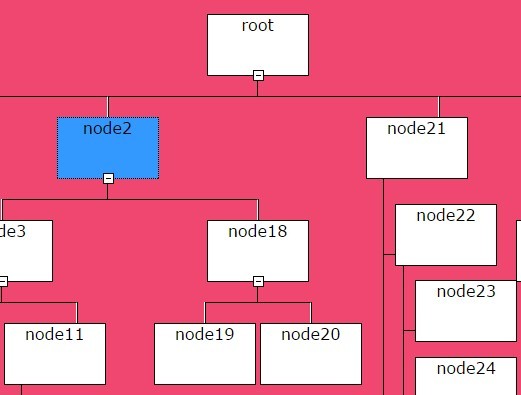
orgChart is a jQuery plugin to generate a simple organization chart that shows the structure & the reporting relationship in your company. Click on the node's name to edit. Click on the control bar to add/remove a node.
Basic Usage:
1. Add the required jQuery orgChart plugin's stylesheet in the document's header.
<link href="jquery.orgchart.css" rel="stylesheet">
2. Create a container where the plugin will render an organization chart from a JS data array.
<div id="orgChart"></div>
3. Include the jQuery JavaScript library at the bottom of your document.
<script src="//code.jquery.com/jquery-1.11.1.min.js"></script>
<script src="jquery.orgchart.js"></script>
4. Add the initial data or your organization chart using Javascript data array as follows. For each node, you must provide an unique ID, an organization name, and a parent level. The data structure should be like this:
var testData = [
    {id: 1, name: 'My Organization', parent: 0},
    {id: 2, name: 'CEO Office', parent: 1},
    {id: 3, name: 'Division 1', parent: 1},
    {id: 4, name: 'Division 2', parent: 1},
    {id: 6, name: 'Division 3', parent: 1},
    {id: 7, name: 'Division 4', parent: 1},
    {id: 8, name: 'Division 5', parent: 1},
    {id: 5, name: 'Sub Division', parent: 3},
];
5. Call the plugin to generate an organization chart from user provided data defined in the previous step.
$(function(){
  org_chart = $('#orgChart').orgChart({
    data: testData, // your data
    showControls: true, // display add or remove node button.
    allowEdit: true, // click the node's title to edit
    onAddNode: function(node){},
    onDeleteNode: function(node){},
    onClickNode: function(node){},
    newNodeText: 'Add Child' // text of add button
});
});
This awesome jQuery plugin is developed by bigeyex. For more Advanced Usages, please check the demo page or visit the official website.