Github Like jQuery Data Visualization Plugin - Glance Year
| File Size: | 11.1 KB |
|---|---|
| Views Total: | 9104 |
| Last Update: | |
| Publish Date: | |
| Official Website: | Go to website |
| License: | MIT |
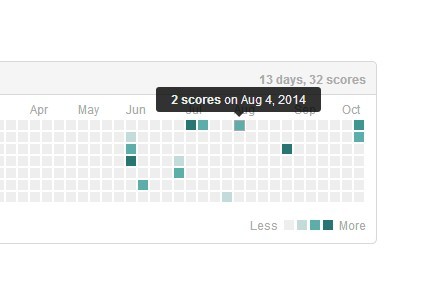
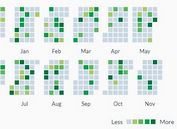
Glance Year is a jQuery data visualization plugin which helps you generate a Github contribution graph style calendar heatmap from a JS data array.
How to use it:
1. Include jQuery library together with jQuery glance year plugin's stylesheet & script in the document.
<link rel="stylesheet" href="glanceyear.css">

<script src="http://code.jquery.com/jquery-1.11.1.min.js"></script>
<script src="jquery.glanceyear.js"></script>
2. Create a DIV container for the calendar heatmap.
<div class="glanceyear-content" id="demo">
</div>
3. Create your data using JS array object as follow.
var massive = [
    {date: '2014-8-3', value:'1'},
    {date: '2014-8-4', value:'2'},
    {date: '2014-9-3', value:'3'},
    {date: '2014-10-14', value:'2'},
    {date: '2014-10-13', value:'8'},
    {date: '2014-7-3', value:'1'},
    {date: '2014-7-4', value:'2'},
    {date: '2014-7-7', value:'3'},
    {date: '2014-7-14', value:'2'},
    {date: '2014-6-3', value:'1'},
    {date: '2014-6-4', value:'2'},
    {date: '2014-6-5', value:'3'},
    {date: '2014-6-14', value:'2'}
];
4. Initialize the plugin to render a calendar heatmap into the DIV container you just created.
$('#demo').glanceyear(massive);
5. Default settings.
$('#demo').glanceyear(massive,{
eventClick: function(e) { alert('Date: ' + e.date + ', Count:' + e.count); },
months: ["Jan","Feb","Mar","Apr","May","Jun","Jul","Aug","Sep","Oct","Nov","Dec"],
weeks: ['M','T','W','T','F','S', 'S'],
targetQuantity: '.glanceyear-quantity',
tagId: 'glanceyear-svgTag',
showToday: false,
today: new Date()
});
Change logs:
2014-11-27
- New parameter "today";
- Fix bug with first month.
2014-11-11
- Every instance fill your own data;
- New parameter "showToday";
- Fix bug with 54 weeks;
- Added minified script.
This awesome jQuery plugin is developed by Kraigo. For more Advanced Usages, please check the demo page or visit the official website.

