Calendar Heatmap Plugin With jQuery And Moment.js - CalendarHeatmap
| File Size: | 98.5 KB |
|---|---|
| Views Total: | 15702 |
| Last Update: | |
| Publish Date: | |
| Official Website: | Go to website |
| License: | MIT |
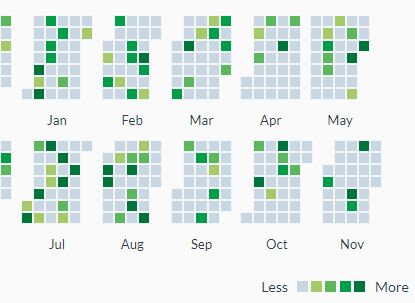
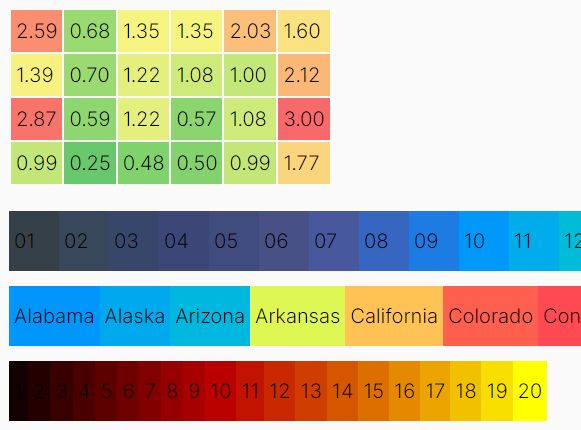
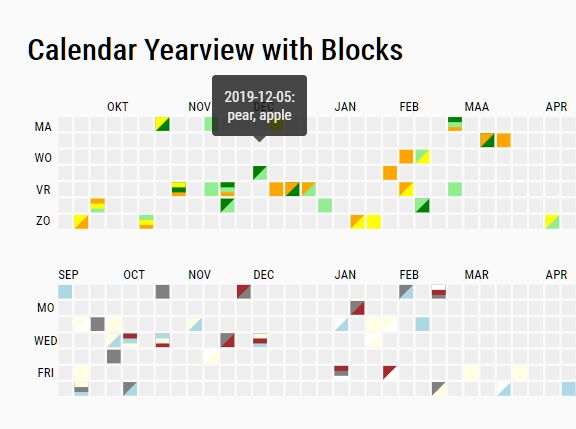
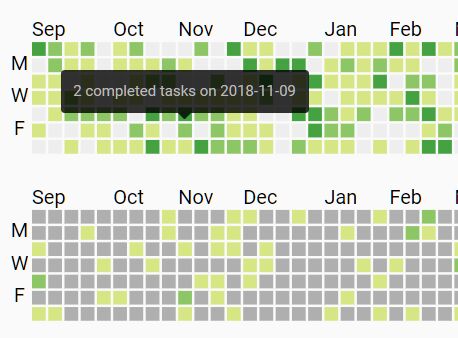
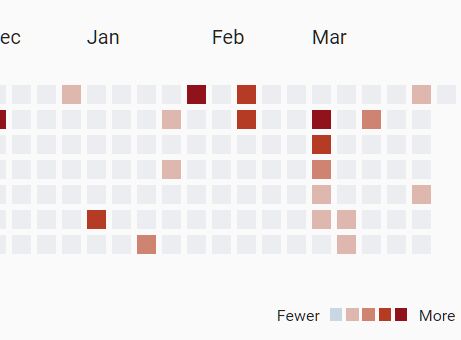
CalendarHeatmap.js is a jQuery plugin used to generate a dynamic, interactive, configurable calendar heatmap for representing time series data.
Hover over the time slots to show details for each of the days on demand. Inspired by Github’s commit calendar graph.
Installation:
# NPM
$ npm install calendarheatmap --save

# Bower
$ bower install calendarheatmap --save
How to use it:
1. Include jQuery JavaScript library and Moment.js (optional) on the web page.
<script src="/path/to/cdn/jquery.slim.min.js"></script>
<script src="/path/to/cdn/moment.min.js"></script>
2. Include the minified version of the jQuery CalendarHeatmap.js plugin after jQuery and moment.js.
<link rel="stylesheet" href="jquery.CalendarHeatmap.css">
<script src="jquery.CalendarHeatmap.min.js"></script>
3. Create a placeholder element for the generated calendar heatmap.
<div id="heatmap-demo"></div>
4. Prepare the data you want to present in the calendar heatmap.
var data = [
    {count: 2, date: "2017-09-23"},
    {count: 1, date: "2017-10-23"},
    {count: 4, date: "2017-11-11"},
    {count: 5, date: "2017-11-13"},
    {count: 3, date: "2017-11-21"},
    ...
]
5. Visualize the data in the calendar heatmap.
$("#heatmap-demo").CalendarHeatmap(data, {
  // options here
});
6. All default options to customize the calendar heatmap.
$("#heatmap-demo").CalendarHeatmap(data, {

  // title of the calendar heatmap
  title: null,

  // the number of months to display
  months: 12,

  // the first day of the week: 1 is Monday
  weekStartDay: 1,

  // or rounded, circle
  tiles: {
    shape: "square"
  },

  // last month
  lastMonth: moment().month() + 1,

  // last year
  lastYear: moment().year(),

  // color gradients
  coloring: null,

  // custom labels
  labels: {
    days: false,
    months: true,
    custom: {
      weekDayLabels: null,
      monthLabels: null
    }
  },

  // custom legend
  legend: {
    show: true,
    align: "right",
    minLabel: "Less",
    maxLabel: "More",
    divider: " to "
  },

  // custom tooltips
  // requires Bootstrap
  tooltips: {
    show: false,
    options: {}
  }

});
7. API methods.
// get currently selected dates
$("#heatmap-demo").CalendarHeatmap("getDates");

// update data
$("#heatmap-demo").CalendarHeatmap("updateDates", data);

// append additional data
$("#heatmap-demo").CalendarHeatmap("appendDates", data );

// get options
$("#heatmap-demo").CalendarHeatmap("getOptions");

// update options
$("#heatmap-demo").CalendarHeatmap("updateOptions" {
  // options here
});
Changelog:
v1.3.1 (2021-03-09)
- With this release, moment.js is no longer required
- Moment.js or any other library can be used to format labels
- Fix for heatmaps that cover multiple years
v1.2.0 (2021-03-09)
- New: getDates and getOptions can be used to receive the current list of dates with counts and options from the heatmap
- New: updateDates and appendDates functions are added to allow for changing, or adding dates to the heatmap
- New: updateOptions added to allow for changing heatmap options
- Update: New functions with examples are available in the demo
- Update: All dependencies are updated to their latest versions
- Fix: The heatmap bins and colors have been redone and should be assigned correctly now
v1.1.0 (2020-01-10)
- Update: Tiles in the calendar can be rounded or circles now
- Update: Future days are indicated by lighter colors
- Update: Demo is using Bootstrap 4.x now
- Update: All dependencies are updated to their latest versions
- Fix: Cases with low counts per day, where the maximum is not shown on the map
- Fix: Start day works properly now
- Fix: Unix timestamps get now properly parsed when using the object notation
v1.0.1 (2019-05-15)
- Updated dependancies
2019-02-02
- Complete rewrite on generating heat maps
2017-11-28
- Bugfixed.
This awesome jQuery plugin is developed by SeBassTian23. For more Advanced Usages, please check the demo page or visit the official website.