Subway Map Creator With jQuery And Canvas - subwayMap
| File Size: | 7.17 KB |
|---|---|
| Views Total: | 8530 |
| Last Update: | |
| Publish Date: | |
| Official Website: | Go to website |
| License: | MIT |
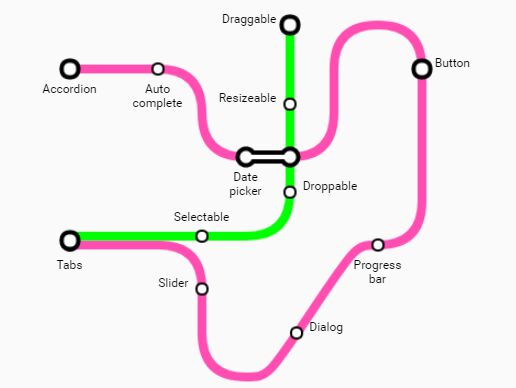
subwayMap is a jQuery plugin that uses HTML5 canvas to draw a dynamic, customizable, metro map-style graphs and infographics on the web page.
Basic usage:
1. Include the latest version of JQuery JavaScript library and the jquery.subwayMap.js script on the web page.
<script src="https://code.jquery.com/jquery-3.2.1.slim.min.js"
        integrity="sha384-KJ3o2DKtIkvYIK3UENzmM7KCkRr/rE9/Qpg6aAZGJwFDMVNA/GpGFF93hXpG5KkN"
        crossorigin="anonymous">
</script>
<script src="jquery.subwayMap-0.5.0.js"></script>
2. Create a container for the legend to help readers understand the map data.
<div id="legend"></div>
3. Add your own nodes and routes to the Subway Map using following data attributes:
- data-columns: The number of columns.
- data-rows: The number of rows.
- data-cellSize: The width and height of each cell in pixels.
- data-legendId: The ID of the map legend.
- data-textClass: The CSS class to use for text labels.
- data-grid: show or hide a grid that is useful during map construction.
- data-gridNumbers: True or false, to show or hide numbers on the grid.
- data-lineWidth: The width in pixels for each line.
- data-color: The color of the line.
- data-label: The label for the line that will be displayed in the legend.
- data-outline: doubles each line with a white one to get an outline effect
- data-coords: The X,Y coordinate pair where the line should be drawn to from its last location .
<div class="subway-map" data-columns="12" data-rows="10" data-cellSize="40" data-legendId="legend" data-textClass="text" data-gridNumbers="true" data-grid="false" data-lineWidth="8">
  <ul data-color="#ff4db2" data-label="jQuery Widgets" data-outline="true">
      <li data-coords="2,2" data-marker="interchange"><a href="http://jqueryui.com/demos/accordion/">Accordion</a></li>
      <li data-coords="4,2"><a href="http://jqueryui.com/demos/autocomplete/"><a href="http://jqueryui.com/demos/autocomplete/">Auto\ncomplete</a></li>
      <li data-coords="5,3" data-dir="E"></li>
      <li data-coords="5,7" data-marker="@station" data-labelPos="W"><a href="http://jqueryui.com/demos/slider/">Slider</a></li> <!-- marker-only node -->
      <li data-coords="6,4" data-dir="S" data-marker="interchange" data-markerInfo="h5"><a href="http://jqueryui.com/demos/datepicker/">Date\npicker</a></li>
      <li data-coords="7,4"></li>
      <li data-coords="7.15,8" data-marker="@station" data-labelPos="E"><a href="http://jqueryui.com/demos/dialog/">Dialog</a></li>  <!-- marker-only node, moved to the right by 0.15 -->
      <li data-coords="8,3" data-dir="E"></li>
      <li data-coords="8,2"></li>
      <li data-coords="9,1" data-dir="N"></li>
      <li data-coords="10,2" data-dir="E" data-marker="interchange" data-labelPos="E"><a href="http://jqueryui.com/demos/button/">Button</a></li>
      <li data-coords="10,5"></li>
      <li data-coords="9,6" data-dir="S" data-marker="station"><a href="http://jqueryui.com/demos/progressbar/">Progress\nbar</a></li>
      <li data-coords="6,9"></li>
      <li data-coords="5,8" data-dir="W"></li>
      <li data-coords="5,7"></li>
      <li data-coords="4,6" data-dir="N"></li>
      <li data-coords="2,6"><a href="http://jqueryui.com/demos/tabs/">Tabs</a></li>
  </ul>

  <ul data-color="#00ff00" data-label="jQuery Interactions" data-shiftCoords="0,-1">
      <li data-coords="2,6"></li>
      <li data-coords="2,5.9" data-marker="@interchange"> </li> <!-- marker-only node, moved up by 0.10 -->
      <li data-coords="5,6" data-marker="@station" data-labelPos="N"><a href="http://jqueryui.com/demos/selectable/">Selectable</a></li>
      <li data-coords="6,6"></li>
      <li data-coords="7,3" data-marker="@station" data-labelPos="W"><a href="http://jqueryui.com/demos/resizeable/">Resizeable</a></li>
      <li data-coords="7,5" data-dir="E" data-marker="station" data-labelPos="E"><a href="http://jqueryui.com/demos/droppable/">Droppable</a></li>
      <li data-coords="7,1" data-marker="interchange" data-labelPos="W"><a href="http://jqueryui.com/demos/draggable/">Draggable</a></li>
  </ul>

</div>
4. Render the subway map on the web page.
$(".subway-map").subwayMap();
Changelog:
2019-10-09
- Replaced offset w/ position in text layer for more predictable behaviour
2018-12-18
- improved legend for dotted lines
2018-12-17
- added new 'outline' option : doubles each line with a white one to get an outline effect
This awesome jQuery plugin is developed by techbubble. For more Advanced Usages, please check the demo page or visit the official website.