Dynamic Line Chart Plugin With jQuery - scale.js
| File Size: | 15.4 KB |
|---|---|
| Views Total: | 3051 |
| Last Update: | |
| Publish Date: | |
| Official Website: | Go to website |
| License: | MIT |

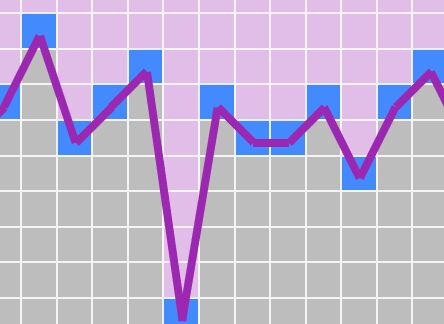
scale.js is a tiny, simple-to-use, AJAX-enabled jQuery data visualization plugin which dynamically renders a line chart on a grid view using plain JavaScript, HTML and CSS.
How to use it:
1. Add jQuery library and the jQuery scale.js plugin's files (JavaScript & Stylesheet) to the web page.
<link rel="stylesheet" href="scale.css">
<script src="//code.jquery.com/jquery.min.js"></script>
<script src="scale.js"></script>
2. Create a container element to place the line chart.
<div id="myChart"></div>
3. Initialize the plugin and define the data to be plotted in the line chart.
$("#myChart").linechart({
  data: items
});
4. If you want to generate a line chart from an external data source.
$.getJSON('data.json', function(res) {
  var items = [];

  $.each(res, function(key, val){
    items.push({
      value: val["value"],
      title: val["title"]
    });
  });

  $("#chart").linechart({
    data: items
  });
});
5. All default options which can be used to customize the line chart.
$("#chart").linechart({

  // width/height
  width: 50,
  height: 50,

  // box size in pixels
  boxSize: 20,

  // shows line
  line: false,

  // 'purple' or 'grey'
  theme: 'default',

});
This awesome jQuery plugin is developed by kis. For more Advanced Usages, please check the demo page or visit the official website.