Github Inspired Punchcard Graph Plugin For jQuery - punchcard.js
| File Size: | 15.4 KB |
|---|---|
| Views Total: | 1541 |
| Last Update: | |
| Publish Date: | |
| Official Website: | Go to website |
| License: | MIT |
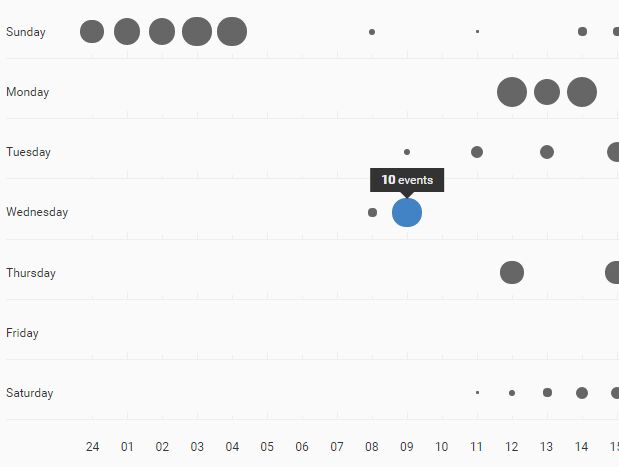
punchcard.js is a jQuery plugin for creating Github-inspired dynamic punchcard graph to visualize the user activity on your web app.
See also:
How to use it:
1. The plugin requires jQuery and moment.js libraries loaded properly in the document.
<script src="/path/to/jquery.min.js"></script>
<script src="/path/to/moment.min.js"></script>
2. Then load the punchcard.js script right before the closing body tag.
<script src="src/punchcard.js"></script>
3. Create a container in which you want to render the punchcard graph.
<div id="punchcardExample"></div>
4. Call the plugin on the container element and define your own data in the JavaScript as follow.
$('#punchcardExample').punchcard({
  data: [
      [3, 0, 0, 1, 0, 0, 5, 5, 1, 2, 5, 0],
      [0, 0, 0, 0, 40, 35, 40, 0, 0, 1, 2, 1, 5],
      [0, 10, 0, 20, 0, 30, 0, 40, 0, 50, 0, 60],
      [3, 10],
      [0, 0, 0, 0, 8, 0, 0, 8, 0, 0, 10, 0, 0, 10, 0, 10],
      [],
      [0, 0, 0,1,2,3,4,5,6,7,8,9,10,11,12,13,14,15,16,17,18]
  ]
});
5. Config the punchcard graph with the following options.
$('#punchcardExample').punchcard({
  days: [
      "Sunday", "Monday", "Tuesday", "Wednesday", "Thursday", "Friday", "Saturday"
  ],
  hours: [
      "24", "01", "02", "03", "04", "05", "06", "07", "08", "09", "10", "11",
      "12", "13", "14", "15", "16", "17", "18", "19", "20", "21", "22", "23"
  ],
  singular: undefined,
  plural: undefined,
  data: undefined,
  ajax: undefined,
  timezones: [],
  timezoneIndex: 0,
  nightModeFrom: undefined,
  nightModeTo: undefined,
});
Change log:
2017-10-02
- Added responsive switch with minWidth
This awesome jQuery plugin is developed by melenaos. For more Advanced Usages, please check the demo page or visit the official website.


