Simple Bar Chart Plugin with jQuery and Bootstrap - jchart
| File Size: | 6.51 KB |
|---|---|
| Views Total: | 61346 |
| Last Update: | |
| Publish Date: | |
| Official Website: | Go to website |
| License: | MIT |
jchart is a lightweight jQuery plugin that renders a clean bar chart with raw data specified in Javascript arrays or in plain old HTML. Worked with Twitter's Bootstrap 3 to provide tooltip support on mouse hover.
How to use it:
1. Include the necessary jQuery javascript library and Boostrap 3 framework in the document.
<link rel="stylesheet" href="http://netdna.bootstrapcdn.com/bootstrap/3.1.1/css/bootstrap.min.css">
<script src="http://ajax.googleapis.com/ajax/libs/jquery/1.11.0/jquery.min.js"></script>
<script src="http://netdna.bootstrapcdn.com/bootstrap/3.1.1/js/bootstrap.min.js"></script>
2. Include the jQuery jChart plugin after jQuery library.
<script src="jchart.js"></script>
3. Create a container for the bar chart that loads data from Javascript arrays.
<div id="demo"></div>
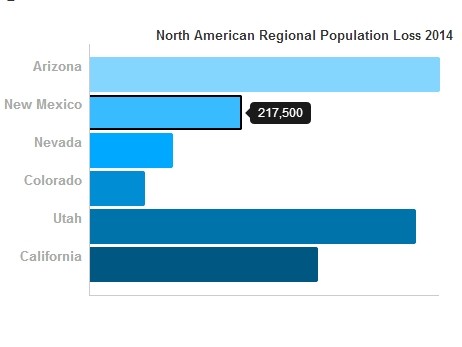
$("#demo").jChart({
name: "North American Regional Population Loss 2014",
headers: ["Arizona","Michigan","Ontario","British Columbia","Texas"],
values: [250000,478000,88000,429000,423000],
footers: [100000,200000,300000,400000,500000],
colors: ["#1000ff","#006eff","#00b6ff","#00fff6","#00ff90"]
});
4. You can also specify the data in the Html with specific classes and data-* attributes.
<div id="bar_of_pies" data-sort="true" data-width="300" class="jChart chart-sm" name="My Favorite Pies">
<div class="define-chart-row" data-color="red" title="Pumpkin">13</div>
<div class="define-chart-row" data-color="gray" title="Pecan">24</div>
<div class="define-chart-row" data-color="green" title="Cherry">17</div>
<div class="define-chart-row" data-color="orange" title="Apple">26</div>
<div class="define-chart-row" data-color="black" title="Rhubarb">12</div>
<div class="define-chart-row" data-color="blue" title="Chocolate Cream">8</div>

<div class="define-chart-footer">10</div>
<div class="define-chart-footer">20</div>
<div class="define-chart-footer">30</div>
</div>

<script>
$(document).ready(function() {
$("#bar_of_pies").jChart();
});
</script>
5. Available options.
<script>
$(document).ready(function() {
$("#demo").jChart({
width: 750, // A number specifying the pixel width of the chart
name: null, // The name of the chart, displayed at the top of the chart
type: "bar",
headers: null, // A Javascript array of bar labels
values: null,
footers: Array(), // A Javascript array of numeric values for each corresponding bar
sort: false,
sort_colors: false,
colors: Array(), // A Javascript array of colors that will loop back if needed
x_label: null
});;
});
</script>
Change log:
2014-05-13
- x axis label fix in js
This awesome jQuery plugin is developed by ldenison. For more Advanced Usages, please check the demo page or visit the official website.


