Animated Interactive Donut Chart with jQuery and Snap.svg
| File Size: | 4.25 KB |
|---|---|
| Views Total: | 23174 |
| Last Update: | |
| Publish Date: | |
| Official Website: | Go to website |
| License: | MIT |
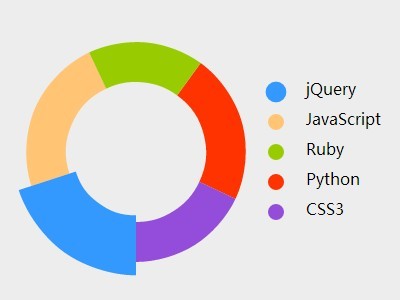
A jQuery & SVG based chart script to draw an interactive donut chart with smooth SVG path animations based on Snap.svg JavaScript SVG library.
How to use it:
1. Create a SVG element for the donut chart.
<svg id="svg"></svg>
2. Include the latest version of jQuery library and the snap.svg SVG library at the bottom of the web page.
<script src="//code.jquery.com/jquery-1.11.1.min.js"></script>
<script src="//cdnjs.cloudflare.com/ajax/libs/snap.svg/0.3.0/snap.svg-min.js"></script>
3. Create your data using JS array object as follows.
var programmingSkills = [
    {
      value: 20,
      label: 'jQuery',
      color: '#3399FF'
    },
    {
      value: 23,
      label: 'JavaScript',
      color: '#FFC575'
    },
    {
      value: 17,
      label: 'Ruby',
      color: '#99CC00'
    },
    {
      value: 22,
      label: 'Python',
      color: '#FF3300'
    },
    {
      value: 18,
      label: 'CSS3',
      color: '#944DDB'
    },
];
4. Include the SVG donut chart framework and done.
<script src="svg-donut-chart-framework.js"></script>
This awesome jQuery plugin is developed by jackmoran. For more Advanced Usages, please check the demo page or visit the official website.