Elegant SVG Pie & Donut Chart Plugin - listtopie.js
| File Size: | 31.8 KB |
|---|---|
| Views Total: | 7786 |
| Last Update: | |
| Publish Date: | |
| Official Website: | Go to website |
| License: | MIT |

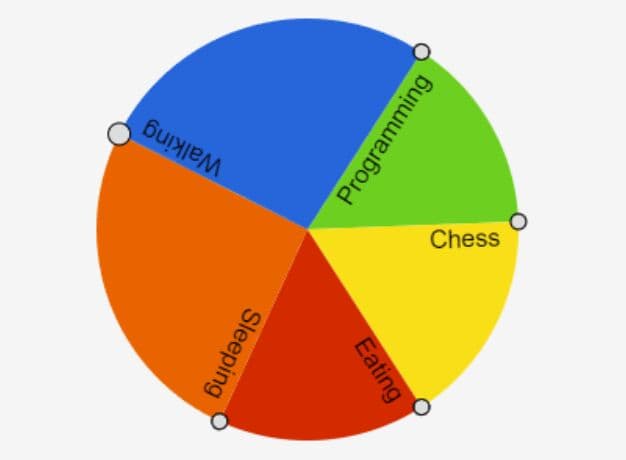
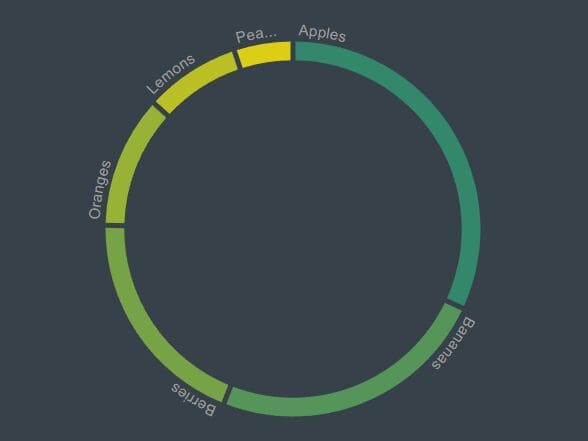
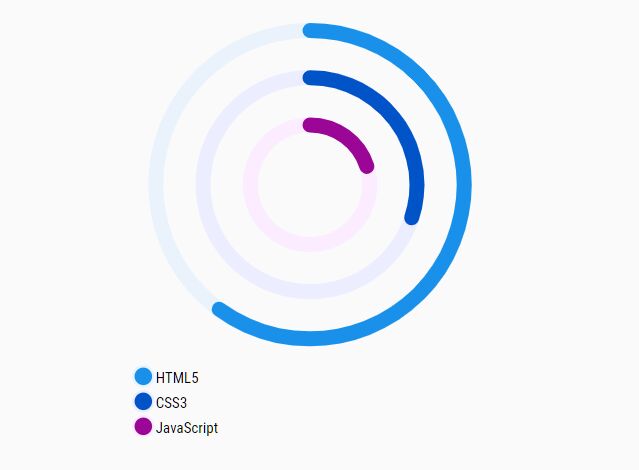
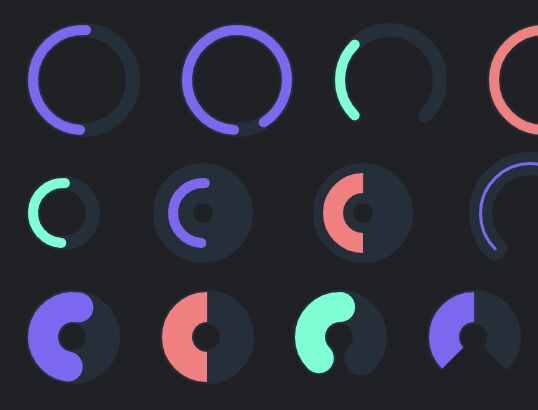
listtopie.js is a jQuery pie chart plugin that makes uses of snap.svg to render an elegant, customizable, animated, nice-looking pie & donut charts for your statistic data.
More features:
- Supports both static and dynamic data (JSON).
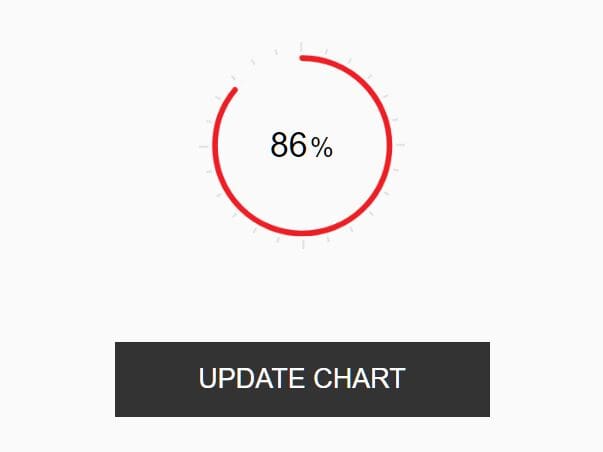
- Optional draw & Round animations.
- Allows to rotate slice on click.
- Shows more information on hover.
- Useful API methods and event listeners.
See Also:
Table Of Contents:
How to use it:
1. To get started, make sure both jQuery, snap.svg, and the listtopie.js plugin are loaded in the document.
<link rel="stylesheet" href="/path/to/css/jquery.listtopie.css" />
<script src="/path/to/cdn/jquery.min.js"></script>
<script src="/path/to/cdn/snap.svg-min.js"></script>
<script src="/path/to/js/jquery.listtopie.min.js"></script>
2. Insert percentage values into the pie slides as follows. You can specify the background color of each slice using the data-lcolor attribute:
<div id="static">
  <div data-lcolor="#ffb6b9">50.2<span>jQuery</span></div>
  <div data-lcolor="#fae3d9">25.6<span>JavaScript</span></div>
  <div data-lcolor="#bbded6">28.2<span>HTML</span></div>
  <div data-lcolor="#61c0bf">25<span>CSS</span></div>
</div>
3. Call the plugin on the top container to draw a basic pie chart on the webpage.
$('#static').listtopie({
  // options
});
4. Load data from JSON.
var data = [
    {
      "name": "Slice 1",
      "value": "20",
      "color": "blue"
    },
    {
      "name": "Slice 2",
      "value": "50",
      "color": "blue"
    }{
      "name": "Slice 3",
      "value": "50",
      "color": "yellow"
    }
]
$('#element').listtopie({
  dataJson: data
});
5. All plugin options to customize the pie & donut graph.
$('#static').listtopie({

  // chart size
  size: 'auto',

  // start angle
  startAngle: 0,

  // 'simple', 'fade', or 'round'
  drawType: 'round',

  // true = all slices have the same size
  useMenu: false,

  // stroke color
  strokeColor: '#cccccc',

  // background color
  backColor: '#ffffff',

  // font family
  fontFamily: 'Arial',

  // font weight
  fontWeight: '400',

  // opaticy level of background color
  backColorOpacity: '0.5',

  // highlights slice on hover
  hoverEvent: true,

  // border color
  hoverBorderColor: 'gray',

   // border width
  hoverWidth: 1,

  // slice color
  hoverSectorColor: false,

  // enables animation on hover
  hoverAnimate: true,

  // animation speed (draw)
  speedDraw: 500,

  // animation speed (rotate)
  speedRotate: 200,

  // displays percent sign at the end
  usePercent: false,

  // easing function
  easingType: mina.linear,

  // stroke width
  strokeWidth: 2,

  // indent from center
  marginCenter: 0,

  // displays values in the slices
  setValues: true,

  // text color
  textColor: '#000000',

  // text size
  textSize: '12',

  // list data
  listVal: false,
  listValClick: false,
  listValMouseOver: false,
  listValClass: 'listtopie-list',
  listValInsertClass: '',
  valList: function( elem, i, val ) {
    return $('<span rel=' + i + ' class="listtopie-link"/>').text(val);
  },

  // rotates the selected slice
  sectorRotate: false,

  // shows information on hover
  infoText: false,

  // opacity of tooltip
  infoTextBlockOpacity: '0.8',

  // uses JSON data
  dataJson: null,

  // where to append the list
  appendList: $(element),

  // set initial slice
  initialChangeSector: 0,
  initialHoverSector: 0

});
6. API methods.
// goto a specific slice
$('.element').listtopie('hoverGoTo', 2);
$('.element').listtopie('changeGoTo', 2);

// update an option
$('.element').listtopie('listtopieSetOption', optionName, optionValue, true);

// get the option value
$('.element').listtopie('listtopieGetOption','useMenu');

// get the current slice
$('.element').listtopie('getCurrentHoverSector', 2);
$('.element').listtopie('getCurrentChangeSector', 2);

// get the slice attribute
$('.element').listtopie('getSectorAttr', 2, sliceName);

// refresh the chart
$('.element').listtopie('refresh');

// destroy the instance
$('.element').listtopie('destroy');
7. Events.
$('.element').on('afterChange', function(event, listtopie){
  // console.log(listtopie.currentChangeSector);
});

$('.element').on('afterHover', function(event, listtopie){
  // console.log(listtopie.currentHoverSector);
});

$('.element').on('init', function(event, listtopie){
  // console.log('Initialized');
});

$('.element').on('uninit', function(event, listtopie){
  // console.log('Destroyed');
});
This awesome jQuery plugin is developed by dkdevru. For more Advanced Usages, please check the demo page or visit the official website.