Customizable Pie Chart/Round Progress Bar Plugin - easy-pie-chart
| File Size: | 55.8 KB |
|---|---|
| Views Total: | 17888 |
| Last Update: | |
| Publish Date: | |
| Official Website: | Go to website |
| License: | MIT |
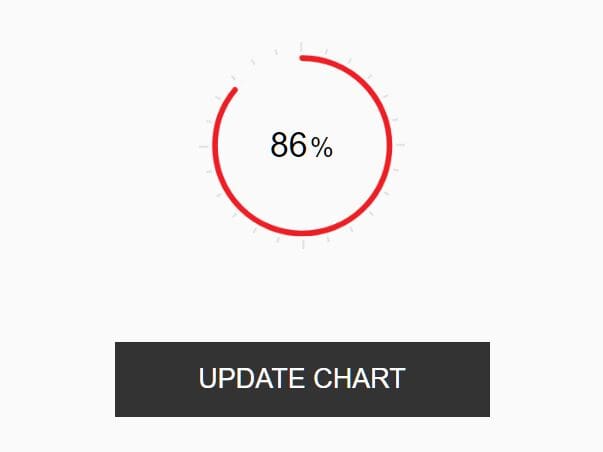
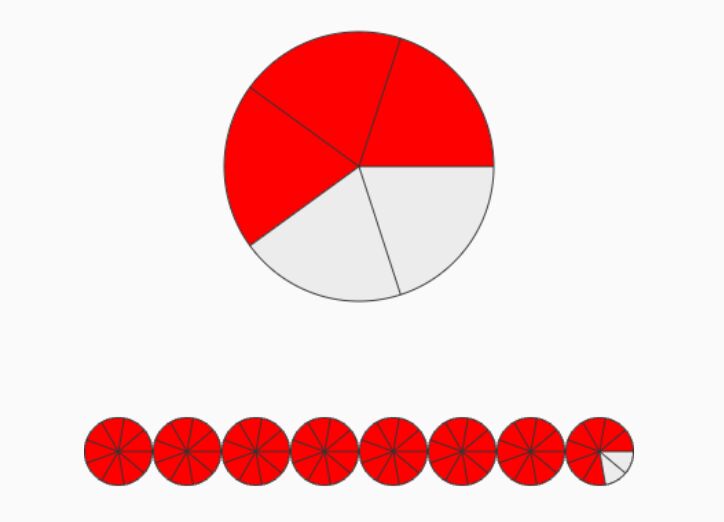
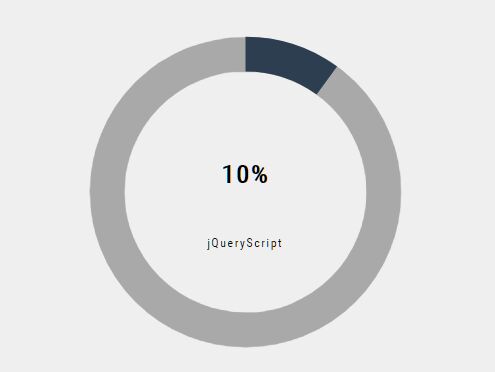
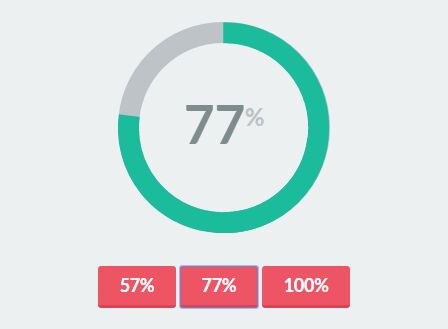
easy-pie-chart is a lightweight JavaScript/jQuery plugin to draw animated, customizable, retina-ready pie/ring charts and circular progress bars using HTML5 Canvas and requestAnimationFrame API.
See also:
How to use it:
1. Load the easy-pie-chart plugin in the document.
<!-- Vanilla JavaScript -->
<script src="dist/easypiechart.js"></script>

<!-- As a jQuery plugin -->
<script src="/path/to/cdn/jquery.min.js"></script>
<script src="dist/jquery.easypiechart.js"></script>
2. Create the HTML for the easy pie chart and define the percent in the data-percent attribute.
<span class="chart" data-percent="86">
  <span class="percent"></span>
</span>
3. Initialize the plugin with default settings.
// Vanilla JavaScript
const myChart = new EasyPieChart(document.querySelector('.chart'), {
      // options here
});

// jQuery
$(function() {
  $('.chart').easyPieChart({
    // options here
  });
});
4. Possible options to customize the easy pie chart.
$(function() {
  $('.chart').easyPieChart({
    barColor: "#ef1e25",
    trackColor: "#f9f9f9",
    trackBorderColor: false,
    trackBorderWidth: 1,
    fillColor: false,
    scaleColor: "#dfe0e0",
    scaleLength: 5,
    scaleCount: 24,
    lineCap: "round", // 'butt', 'round' or 'square'
    lineWidth: 3,
    trackWidth: void 0,
    size: 110,
    rotate: 0,
    arcLength: 360,
    max: 100,
    responsive: false,
    canvasClass: "easy-pie-chart-canvas",
    animate: {
      duration: 1e3,
      enabled: true
    },
    easing: defaultEasing,
    renderer: CanvasRenderer
  });
});
5. Callbacks & event handlers.
$(function() {
  $('.chart').easyPieChart({
    onStart: function(from, to) {
      return;
    },
    onStep: function(from, to, currentValue) {
      return;
    },
    onStop: function(from, to) {
      return;
    }
  });
});
6. API methods.
// update the chart
chart.update(40);

// disable the animation
chart.disableAnimation();

// enable the animation
chart.enableAnimation();

// set options
chart.setOptions(options);

// destroy the instance
chart.destroy()

// stop the animation
chart.stop()
Changelog:
v3.1.0 (2026-07-23)
- Rewritten in TypeScript
This awesome jQuery plugin is developed by rendro. For more Advanced Usages, please check the demo page or visit the official website.