OrgChart: Interactive Organization Chart in Vanilla JavaScript
| File Size: | 1.24 MB |
|---|---|
| Views Total: | 141481 |
| Last Update: | |
| Publish Date: | |
| Official Website: | Go to website |
| License: | MIT |
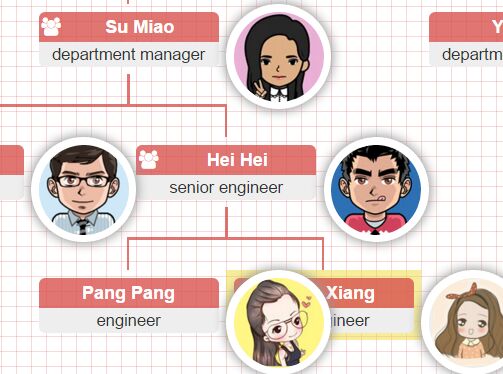
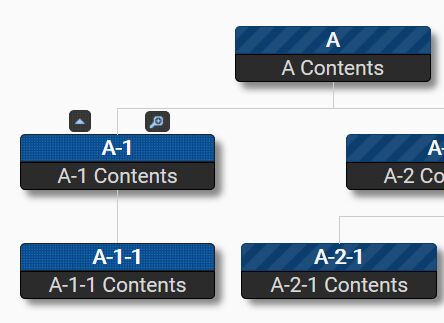
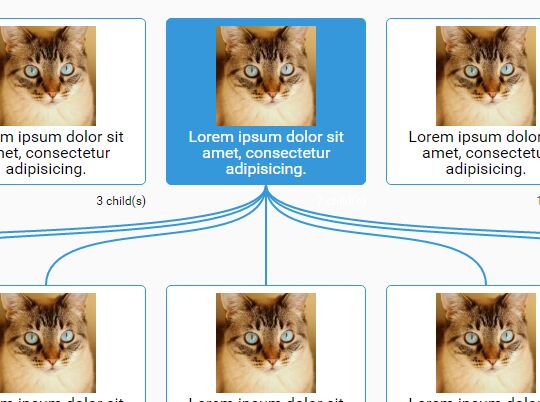
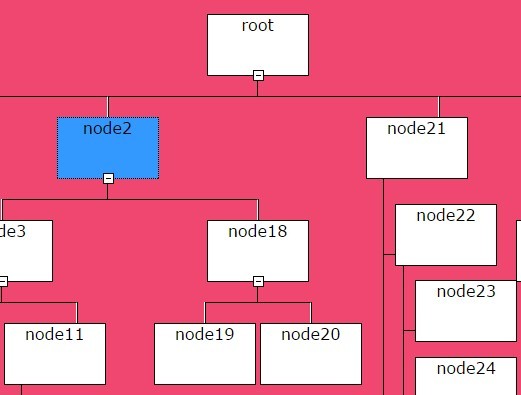
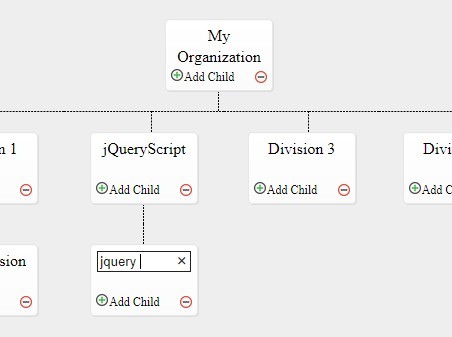
OrgChart (v6) is a Vanilla JavaScript organization chart library (formerly a jQuery plugin) that generates interactive hierarchy trees from JSON data or nested HTML lists.
It's ideal for company reporting charts, editable team structures, family trees, and large hierarchies where you need need pan, zoom, drag and drop, hybrid layouts, or minimap navigation.
Version 6 replaces the legacy jQuery plugin API with a native OrgChart constructor, native DOM elements, and native browser events.
Features:
- Renders hierarchical charts from JSON data or nested
<ul>markup. - Expands and collapses branches with CSS transitions.
- Places charts in top-to-bottom, bottom-to-top, left-to-right, or right-to-left layouts.
- Supports pan, mouse-wheel zoom, and minimap navigation.
- Reorders hierarchy nodes through drag and drop.
- Adds, removes, and reorganizes nodes at runtime.
- Returns an edited hierarchy as a JSON object.
- Exports charts to PNG or PDF.
- Supports custom node markup and custom icon sets.
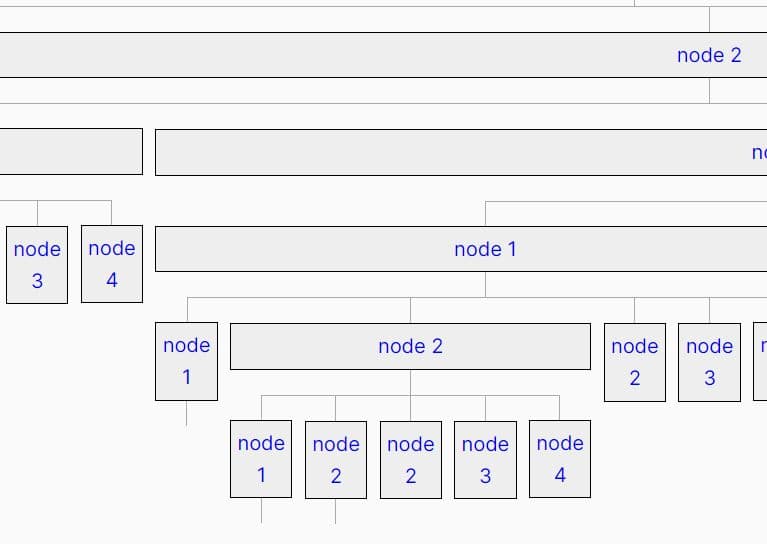
- Uses compact and hybrid layouts for dense hierarchies.
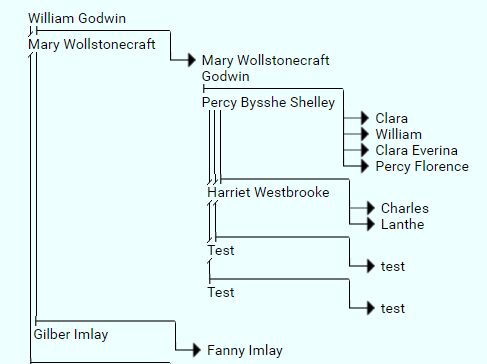
- Builds family trees from multi-dimensional hierarchy data.
- Supports touch interaction on mobile devices.
Use Cases:
- Map reporting lines inside an HR dashboard and let administrators reorganize teams through drag and drop.
- Build an employee directory with custom node cards, collapsed departments, and several hierarchy levels.
- Display a genealogy or pedigree tree with spouses, children, and custom family attributes.
- Navigate a large corporate structure with pan, zoom, compact branches, hybrid layouts, and a minimap.
Installation:
# NPM
$ npm install orgchart --save

# Bower
$ bower install orgchart --save
How to use OrgChart:
Basic usage:
1. Load the stylesheet first, add a chart container, then load orgchart.js before your initialization code.
<link rel="stylesheet" href="/dist/css/orgchart.css">
<script src="/dist/js/orgchart.js"></script>
<div id="company-org-chart"></div>
2. Create a nested data object and pass it to the OrgChart constructor. chartContainer identifies the DOM element that receives the chart. data defines the hierarchy. The default node title field is name, while nodeContent: 'title' adds the job title beneath each name.
var companyData = {
  id: 'chief-executive',
  name: 'Maya Chen',
  title: 'Chief Executive Officer',
  children: [
    {
      id: 'product-team',
      name: 'Jordan Lee',
      title: 'VP of Product',
      children: [
        {
          id: 'product-design',
          name: 'Avery Brooks',
          title: 'Design Director'
        },
        {
          id: 'product-research',
          name: 'Morgan Ellis',
          title: 'Research Lead'
        }
      ]
    },
    {
      id: 'engineering-team',
      name: 'Sam Rivera',
      title: 'VP of Engineering',
      children: [
        {
          id: 'web-platform',
          name: 'Taylor Kim',
          title: 'Web Platform Lead'
        }
      ]
    }
  ]
};

var orgChart = new OrgChart({
  chartContainer: '#company-org-chart',
  data: companyData,
  nodeContent: 'title',
  visibleLevel: 3
});
OrgChart Data Structure
A standard node can contain an ID, display values, state information, CSS classes, relationship metadata, and nested children. Useful node properties include:
id: Sets the node identifier. Unique IDs are important when you need hierarchy export or programmatic node lookup.children: Contains nested descendant data.collapsed: Starts the node with its children collapsed when set totrue.className: Adds custom CSS classes to the rendered node.relationship: Describes the presence of parents, siblings, and children with a three-character0or1string. On-demand loading relies on this metadata.hybrid: Arranges descendants vertically when the value is truthy.compact: Renders the node and its descendants in compact mode when the value is truthy.levelOffset: Supports custom level positioning when used with the related node customization pattern.outsider: Marks an outside member in family-tree data.
var departmentData = {
  id: 'operations',
  name: 'Operations',
  title: 'Department',
  className: 'department-node',
  collapsed: false,
  relationship: '001',
  children: [
    {
      id: 'facilities',
      name: 'Facilities',
      title: 'Team',
      relationship: '100'
    },
    {
      id: 'procurement',
      name: 'Procurement',
      title: 'Team',
      relationship: '100'
    }
  ]
};
OrgChart Options
Data And Navigation Options
data(Object, Array, orHTMLUListElement, required): Defines the hierarchy used to render the chart.pan(Boolean, defaultfalse): Lets users move the chart by dragging the chart area.zoom(Boolean, defaultfalse): Activates mouse-wheel zoom.minimap(Boolean, defaultfalse): Adds an overview navigator for large charts.zoominLimit(Number, default7): Sets the maximum zoom-in scale.zoomoutLimit(Number, default0.5): Sets the minimum zoom-out scale.visibleLevel(Positive Integer, default999): Sets how many hierarchy levels start expanded.
Layout Options
direction(String, default"t2b"): Sets chart direction. Supported values aret2b,b2t,l2r, andr2l.verticalLevel(Integer, minimum2): Starts vertical child alignment from a specified hierarchy level.toggleSiblingsResp(Boolean, defaultfalse): Adds separate controls for showing or hiding left and right siblings.chartClass(String, default""): Adds a custom class to the chart. This helps distinguish several OrgChart instances on one page.compact(Function): Returns a truthy value when a node should use compact rendering. This callback takes priority over thecompactdata property.
Node Content Options
nodeTitle(String, default"name"): Selects the data property used for the main node title.nodeContent(String): Selects the data property used for the secondary content area.nodeId(String, default"id"): Selects the data property used as each node's unique identifier.parentNodeSymbol(String, default"oci-menu"): Sets the icon class that marks nodes with children.nodeTemplate(Function): Receives node data and returns custom markup for the node.createNode(Function): Receives the rendered node element and its data after node creation.
Example:
var orgChart = new OrgChart({
  chartContainer: '#employee-chart',
  data: companyData,
  nodeContent: 'title',

  createNode: function(node, data) {
    if (data.department) {
      node.setAttribute('data-department', data.department);
    }
  }
});
Drag And Drop Options
draggable(Boolean, defaultfalse): Activates node drag and drop.dropCriteria(Function): ReceivesdraggedNode,dragZone, anddropZone. Return a Boolean value to accept or reject the relationship change.
var orgChart = new OrgChart({
  chartContainer: '#editable-org-chart',
  data: companyData,
  draggable: true,

  dropCriteria: function(draggedNode, dragZone, dropZone) {
    return !draggedNode.classList.contains('locked-position');
  }
});
Export Options
exportButton(Boolean, defaultfalse): Adds the built-in export button.exportButtonName(String, default"Export"): Sets the export button label.exportFilename(String, default"OrgChart"): Sets the downloaded file name.exportFileextension(String, default"png"): Selectspngorpdf.exportScale(Number, default2): Sets the render scale used during chart export.
Lifecycle And Icon Options
initCompleted(Function): Runs after the chart finishes its initial render. It receives the rendered chart element.icons(Object): Replaces the built-in icon class map. You can use another icon library such as Font Awesome.
var orgChart = new OrgChart({
  chartContainer: '#icon-chart',
  data: companyData,

  icons: {
    theme: 'fa-solid fa-sm',
    parentNode: 'fa-user-tie',
    expandToUp: 'fa-angles-up',
    collapseToDown: 'fa-angles-down',
    collapseToLeft: 'fa-angles-left',
    expandToRight: 'fa-angles-right',
    collapsed: 'fa-circle-plus',
    expanded: 'fa-circle-minus'
  }
});
OrgChart API Methods
An OrgChart instance exposes its native container through chartContainer and its rendered chart through chart.
var orgChart = new OrgChart({
  chartContainer: '#company-org-chart',
  data: companyData
});

console.log(orgChart.chartContainer);
console.log(orgChart.chart);
Initialization And Runtime Options
orgChart.init(options): Rebuilds the chart with updated options or data. It returns the OrgChart instance.orgChart.setOptions(options): Updates supported runtime settings. Passingdatarebuilds the hierarchy. It returns the OrgChart instance.orgChart.setOptions(name, value): Changespan,zoom, orminimapthrough an option name and Boolean value. It returns the OrgChart instance.
orgChart.setOptions('minimap', true);

orgChart.setOptions({
  pan: true,
  zoom: true
});

orgChart.init({
  data: updatedCompanyData
});
Minimap Methods
orgChart.attachMinimap(): Creates the minimap for the current chart.orgChart.detachMinimap(): Removes the minimap.orgChart.updateMinimap(forceRefresh): Recalculates minimap state. Passtrueto redraw its node preview.
For normal UI toggling, setOptions('minimap', true) and setOptions('minimap', false) keep the option state and minimap state synchronized.
Hierarchy Editing Methods
orgChart.addAncestors(data, parentId): Adds ancestor data above the current hierarchy and attaches the existing root toparentId.orgChart.addDescendants(data, parent): Adds descendant data beneath a native parent node element.orgChart.addParent(currentRoot, data): Wraps the current root with a new parent node.orgChart.addSiblings(node, data): Adds sibling nodes beside a native node element.orgChart.addChildren(node, data): Adds child nodes beneath a native node element.orgChart.removeNodes(node): Removes a node and its descendants.
var engineeringNode = document.getElementById('engineering-team');

orgChart.addChildren(engineeringNode, [
  {
    id: 'quality-engineering',
    name: 'Quality Engineering',
    title: 'Team'
  }
]);
Hierarchy Query Methods
orgChart.getHierarchy(includeNodeData): Returns the current hierarchy object. Passtrueto include node data along with IDs and children.orgChart.getNodeState(node, relation): Returns{ exist, visible }forparent,children, orsiblings.orgChart.getParent(node): Returns the direct parent node ornull.orgChart.getChildren(node): Returns an array of direct child node elements.orgChart.getSiblings(node): Returns an array of direct sibling node elements.orgChart.getRelatedNodes(node, relation): Queriesparent,children, orsiblingsthrough one generalized method.
var productNode = document.getElementById('product-team');

var children = orgChart.getChildren(productNode);
var parent = orgChart.getParent(productNode);
var state = orgChart.getNodeState(productNode, 'children');

console.log(children);
console.log(parent);
console.log(state);
Branch Visibility Methods
orgChart.hideParent(node): Hides a node's parent and the related sibling branch.orgChart.showParent(node): Reveals the parent branch.orgChart.hideChildren(node): Hides direct child branches.orgChart.showChildren(node): Reveals child branches.orgChart.hideSiblings(node, direction): Hides siblings. Setdirectiontoleftorright, or omit it for both sides.orgChart.showSiblings(node, direction): Reveals siblings on one side or both sides.
Zoom Method
orgChart.setChartScale(chart, multiplier, zoomAnchor): Changes chart scale within the configured zoom limits.zoomAnchoraccepts viewport coordinates in the form{ x, y }.
orgChart.setChartScale(orgChart.chart, 1.2, {
  x: window.innerWidth / 2,
  y: window.innerHeight / 2
});
Export Methods
orgChart.export(filename, extension): Exports the current chart as PNG or PDF. It returnsfalsewhen the chart cannot be exported.orgChart.exportPNG(canvas, filename): Downloads a prepared canvas as PNG.orgChart.exportPDF(canvas, filename, exportScale): Downloads a prepared canvas as PDF.
Most applications only need export().
orgChart.export('engineering-structure', 'png');
OrgChart Events
`nodedrop.orgchart`
Fires on the chart before OrgChart moves a dragged node. event.detail contains draggedNode, dragZone, and dropZone.
Call event.preventDefault() to cancel the move.
orgChart.chart.addEventListener('nodedrop.orgchart', function(event) {
  var detail = event.detail;

  console.log('Dragged node:', detail.draggedNode);
  console.log('Drop target:', detail.dropZone);
});
`otherdropped.orgchart`
Fires when another draggable DOM item is dropped onto an OrgChart node.
event.detail contains:
draggedItem
dropZone
`init.orgchart`
Fires after OrgChart renders the chart.
The event bubbles, so an application can register the first-render listener on the chart container before it creates the OrgChart instance.
var container = document.getElementById('company-org-chart');

container.addEventListener('init.orgchart', function(event) {
  console.log('Chart initialized:', event.target);
});

var orgChart = new OrgChart({
  chartContainer: '#company-org-chart',
  data: companyData
});
`show-[relation].orgchart`
Fires on a node when OrgChart reveals related nodes.
The relation can be:
parent
children
siblings
Examples include:
show-parent.orgchart
show-children.orgchart
show-siblings.orgchart
`hide-[relation].orgchart`
Fires when OrgChart hides a parent, child branch, or sibling branch.
Examples include:
hide-parent.orgchart
hide-children.orgchart
hide-siblings.orgchart
Advanced Examples
Add Employees From An Admin Form
<form id="add-report-form">
  <label>
    Manager ID
    <select id="manager-id">
      <option value="product-team">Product Team</option>
      <option value="engineering-team">Engineering Team</option>
    </select>
  </label>

  <label>
    Employee name
    <input id="employee-name" type="text" required>
  </label>

  <label>
    Job title
    <input id="employee-title" type="text" required>
  </label>

  <button type="submit">Add employee</button>
</form>
document.getElementById('add-report-form').addEventListener('submit', function(event) {
  event.preventDefault();

  var managerId = document.getElementById('manager-id').value;
  var employeeName = document.getElementById('employee-name').value;
  var employeeTitle = document.getElementById('employee-title').value;

  var managerNode = document.getElementById(managerId);

  if (!managerNode) {
    return;
  }

  orgChart.addChildren(managerNode, [
    {
      id: 'employee-' + Date.now(),
      name: employeeName,
      title: employeeTitle
    }
  ]);

  var hierarchy = orgChart.getHierarchy(true);

  console.log(hierarchy);
});
Build A Navigable Large Organization Chart
Pan, zoom, and minimap controls help users move through a hierarchy that extends beyond the viewport.
var largeOrgChart = new OrgChart({
  chartContainer: '#enterprise-chart',
  data: enterpriseData,
  nodeContent: 'position',
  visibleLevel: 4,
  direction: 'l2r',
  pan: true,
  zoom: true,
  minimap: true
});
Load Organization Data From An API
OrgChart does not need to own the network request. Fetch the JSON first and create the chart after the request finishes.
fetch('/api/company/hierarchy')
  .then(function(response) {
    if (!response.ok) {
      throw new Error('Unable to load organization data.');
    }

    return response.json();
  })
  .then(function(data) {
    window.remoteOrgChart = new OrgChart({
      chartContainer: '#remote-org-chart',
      data: data,
      nodeContent: 'position',
      pan: true,
      zoom: true
    });
  })
  .catch(function(error) {
    console.error(error);
  });
Migrating jQuery OrgChart 5.x To Version 6.0.0
OrgChart 6.0.0 removes the jQuery dependency and replaces the jQuery plugin interface with native JavaScript. Existing hierarchy data and many configuration options remain familiar, but initialization, node references, events, and DOM operations need to be updated.
1. Replace The jQuery Build
OrgChart 5.x:
<link rel="stylesheet" href="jquery.orgchart.css">
<script src="jquery.min.js"></script>
<script src="jquery.orgchart.js"></script>
OrgChart 6.0.0:
<link rel="stylesheet" href="orgchart.css">
<script src="orgchart.js"></script>
jQuery is no longer required by OrgChart.
2. Replace The jQuery Plugin Call
OrgChart 5.x:
var oc = $('#chart-container').orgchart({
  data: datasource,
  nodeContent: 'title'
});
OrgChart 6.0.0:
var oc = new OrgChart({
  chartContainer: '#chart-container',
  data: datasource,
  nodeContent: 'title'
});
The container now belongs in the chartContainer option.
3. Pass Native DOM Elements To Methods
Methods that operate on nodes now use native HTMLElement objects instead of jQuery objects.
OrgChart 5.x:
var $node = $('#manager');
oc.addChildren($node, newEmployees);
OrgChart 6.0.0:
var node = document.getElementById('manager');
oc.addChildren(node, newEmployees);
The same change applies to methods such as addSiblings(), removeNodes(), getParent(), getChildren(), hideChildren(), and showSiblings().
4. Replace jQuery Events With Native Events
Use addEventListener() for OrgChart 6 events and read event data from event.detail.
oc.chart.addEventListener('nodedrop.orgchart', function(event) {
  var draggedNode = event.detail.draggedNode;
  var dropZone = event.detail.dropZone;
});
Call event.preventDefault() when a cancelable OrgChart event, such as nodedrop.orgchart, should not continue.
5. Replace jQuery DOM Helpers
Standard DOM APIs replace jQuery helpers in custom OrgChart code.
// jQuery
$('.orgchart').addClass('noncollapsable');

// Vanilla JavaScript
oc.chart.classList.add('noncollapsable');
Use classList, style, querySelector(), querySelectorAll(), and other native DOM APIs for code that previously manipulated OrgChart elements through jQuery.
Migration Checklist
- Replace
jquery.orgchart.csswithorgchart.css. - Replace
jquery.orgchart.jswithorgchart.js. - Remove jQuery if the rest of the page does not use it.
- Replace
$(...).orgchart()withnew OrgChart(). - Add
chartContainerto the constructor options. - Pass native DOM elements to OrgChart methods.
- Replace
.on()withaddEventListener(). - Read custom event data from
event.detail. - Replace jQuery DOM helpers with native DOM APIs.
Alternatives & Related Resources:
- Fancytree: jQuery and jQuery UI Dynamic Tree View Plugin
- jsTree: Powerful Dynamic Tree Plugin With jQuery
- 10 Best Organization Chart JavaScript/CSS Libraries
- 10 Best Tree View Plugins In JavaScript And Pure CSS
Changelog:
v6.0.0 (2026-08-08)
- Rewritten with native JavaScript and removed the jQuery dependency.
- Switched to the
OrgChartconstructor, native DOM elements, and nativeCustomEventevents.
v5.0.0 (2024-12-16)
- Added Family Tree support.
v4.0.0 (2023-12-17)
- Removed the
ajaxURLoption. Applications now manage AJAX data loading directly. - Removed the
load-[relation].orgchartevents. - Added
addAncestors()andaddDescendants()methods.
v3.8.0 (2023-06-22)
- Added compact layouts through the
compactdata property and option.
v3.7.0 (2023-05-10)
- Added support for replacing the built-in icons with Font Awesome or other icon sets.
v3.5.0 (2023-02-23)
- Added per-branch vertical layouts through datasource properties.
v3.4.0 (2023-02-22)
- Added drag and drop support to hybrid horizontal and vertical charts.
v3.0.0 (2021-02-15)
- Rebuilt the chart structure with nested
<ul>elements instead of nested tables.
v2.2.0 (2021-01-07)
- Added a custom export button name.
- Added optional node data to
getHierarchy(). - Added events for AJAX insertion and branch visibility changes.
v2.1.10 (2020-01-21)
- Added built-in OCI icons and removed the Font Awesome dependency.
v2.0.16 (2018-01-12)
- Added touch support for node drag and drop.
This awesome jQuery plugin is developed by dabeng. For more Advanced Usages, please check the demo page or visit the official website.