Basic Horizontal Bar Chart Plugin For jQuery - rumcaJS
| File Size: | 19.2 KB |
|---|---|
| Views Total: | 8387 |
| Last Update: | |
| Publish Date: | |
| Official Website: | Go to website |
| License: | MIT |
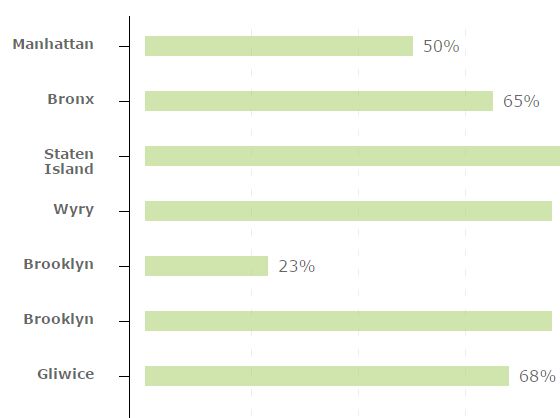
rumcaJS is a tiny and easy to customize jQuery plugin used to render a responsive, horizontal and data-driven bar chart on the webpage.
How to use it:
1. Download and include the jQuery rumcaJS plugin's script after jQuery JavaScript library.
<script src="//code.jquery.com/jquery-1.12.0.min.js"></script>
<script src="js/horizontalChart.js"></script>
2. Create a DIV container to place the horizontal chart.
<div id="default-chart"><div>
3. Prepare your data in the JavaScript like this:
var data = [{
    "name": "Miasta",
    "axisY": [
        "Manhattan",
        "Bronx",
        "Staten Island",
        "Wyry",
        "Brooklyn",
        "Brooklyn",
        "Gliwice"
    ],
    "axisX": ["10%", "20%", "30%", "40%", "50%", "60%", "70%", "80%", "90%", "100%"],
    "bars": [50, 65, 90, 76, 23, 76, 68]
},
{
    "name": "Coca-cola - składniki",
    "axisY": [
        "Pomidor",
        "Woda",
        "Cukier",
        "Karmel",
        "Kofeina",
        "Dwutlenek węgla"
    ],
    "axisX": ["10%", "20%", "30%", "40%", "50%", "60%", "70%", "80%", "90%", "100%"],
    "bars": [32, 23, 76, 68, 4, 97]
}];
4. Present your data as a horizontal bar chart in the container you created.
$('#default-chart').horizontalChart();
5. The primary CSS styles for the bar chart.
.chart { margin: 70px 0 0; }

@media screen and (min-width: 768px) {

.chart {
  margin: 70px 0 50px 0;
  padding: 0 30px 30px;
  background-color: #eeeeee;
}

}

.chart__container {
  position: relative;
  padding: 5px;
  margin-top: 30px;
  background-color: #fff;
  box-sizing: border-box;
  -webkit-box-shadow: none;
  -ms-box-shadow: none;
  -moz-box-shadow: none;
  -o-box-shadow: none;
  box-shadow: none;
}

@media screen and (min-width: 768px) {

.chart__container {
  -webkit-box-shadow: 0px 0px 2px rgba(0, 0, 0, 0.1);
  -ms-box-shadow: 0px 0px 2px rgba(0, 0, 0, 0.1);
  -moz-box-shadow: 0px 0px 2px rgba(0, 0, 0, 0.1);
  -o-box-shadow: 0px 0px 2px rgba(0, 0, 0, 0.1);
  box-shadow: 0px 0px 2px rgba(0, 0, 0, 0.1);
}

}

@media screen and (min-width: 768px) {

.chart__container { padding: 30px; }

}

.chart__axis-y {
  padding: 40px 0 15px;
  color: rgba(0, 0, 0, 0.6);
  position: relative;
  z-index: 1;
  text-align: left;
  top: -16px;
  left: 15px;
  font-weight: 600;
  font-size: 12px;
}

@media screen and (min-width: 768px) {

.chart__axis-y {
  width: 120px;
  padding: 15px 0;
  text-align: right;
  font-size: 14px;
  font-weight: 700;
  top: 0;
  left: 0;
}

}

@media screen and (min-width: 1024px) {

.chart__axis-y { width: 170px; }

}

.chart__axis-x {
  width: 100%;
  padding-top: 10px;
  padding-right: 15px;
  padding-bottom: 15px;
  padding-left: 15px;
  color: rgba(0, 0, 0, 0.6);
  box-sizing: border-box;
  font-size: 11px;
}

@media screen and (min-width: 768px) {

.chart__axis-x {
  padding-top: 15px;
  padding-left: 145px;
  font-size: 14px;
}

}

@media screen and (min-width: 1024px) {

.chart__axis-x {
  padding-left: 195px;
  font-size: 16px;
}

}

.chart__label-y {
  display: block;
  height: 55px;
  position: relative;
  padding: 5px 35px 5px 0;
  box-sizing: border-box;
  line-height: 1.1;
}

.chart__label-y:before {
  content: '';
  display: none;
  position: absolute;
  top: 15px;
  right: 0;
  height: 1px;
  background-color: #000;
  width: 10px;
}

@media screen and (min-width: 768px) {

.chart__label-y:before { display: block; }

}

.chart__label-x {
  display: inline-block;
  width: 10%;
  position: relative;
  right: -10px;
  padding-top: 10px;
  text-align: right;
}

@media screen and (max-width: 1279px) {

.chart__label-x:nth-child(odd) { opacity: 0; }

}

.chart__label-x:before {
  content: '';
  position: absolute;
  top: -10px;
  right: 10px;
  width: 1px;
  background-color: #000;
  height: 10px;
}

@media screen and (min-width: 768px) {

.chart__label-x:before {
  top: -15px;
  right: 20px;
}

}

.chart__box {
  height: 100%;
  width: 100%;
  position: absolute;
  top: 0;
  right: 0;
  bottom: 0;
  padding: 0 15px;
  border-left: 1px solid #000;
  border-bottom: 1px solid #000;
  box-sizing: border-box;
}

@media screen and (min-width: 768px) {

.chart__box {
  padding: 0 25px 0 15px;
  width: calc(100% - 170px + 50px);
}

}

@media screen and (min-width: 1024px) {

.chart__box { width: calc(100% - 170px); }

}

.chart--top { position: relative; }

/*------------------------------------*\
    # CHART - Horizontal bars
\*------------------------------------*/

.chart--horizontal {
  color: rgba(0, 0, 0, 0.6);
  padding-top: 25px;
}

@media screen and (min-width: 768px) {

.chart--horizontal { padding-top: 0; }

}

.chart--horizontal .chart__bars {
  padding: 15px 0 1px;
  background-image: linear-gradient(to top, #fff 13px, transparent 1px), linear-gradient(to left, #eeeeee 1px, transparent 1px);
  background-size: 20% 20px;
  background-position: left;
}

@media screen and (min-width: 1024px) {

.chart--horizontal .chart__bars {
  background-size: 10% 20px;
  background-image: linear-gradient(to top, #fff 13px, transparent 1px), linear-gradient(to left, #e1e1e1 1px, transparent 1px);
}

}

.chart--horizontal .bar__container {
  width: 100%;
  height: 20px;
  position: relative;
  margin: 17.5px 0 35px;
  padding-right: 10px;
  box-sizing: border-box;
  background-clip: content-box;
}

.chart--horizontal .bar__container:first-of-type { margin-top: 5px; }

.chart--horizontal .bar__container:after {
  content: attr(data-value) "%";
  position: absolute;
  left: 100%;
  opacity: 0;
  padding-left: 10px;
  font-size: 14px;
  -webkit-transition: opacity 0s ease-in-out 1.2s;
  -ms-transition: opacity 0s ease-in-out 1.2s;
  -moz-transition: opacity 0s ease-in-out 1.2s;
  -o-transition: opacity 0s ease-in-out 1.2s;
  transition: opacity 0s ease-in-out 1.2s;
}

@media screen and (min-width: 768px) {

.chart--horizontal .bar__container:after { font-size: 16px; }
}

.chart__container.visible .chart--horizontal .bar__container:after {
  opacity: 1;
  -webkit-transition: opacity 0.5s ease-in-out 1.2s;
  -ms-transition: opacity 0.5s ease-in-out 1.2s;
  -moz-transition: opacity 0.5s ease-in-out 1.2s;
  -o-transition: opacity 0.5s ease-in-out 1.2s;
  transition: opacity 0.5s ease-in-out 1.2s;
}

.chart--horizontal .bar {
  height: 20px;
  display: block;
  position: absolute;
  top: 0;
  right: 100%;
  bottom: 0;
  left: 0;
  background-color: rgba(160, 200, 90, 0.5);
  -webkit-transition: all 0s ease-in-out;
  -ms-transition: all 0s ease-in-out;
  -moz-transition: all 0s ease-in-out;
  -o-transition: all 0s ease-in-out;
  transition: all 0s ease-in-out;
}

.chart__container.visible .chart--horizontal .bar {
  -webkit-transition: all 1.2s ease-in-out;
  -ms-transition: all 1.2s ease-in-out;
  -moz-transition: all 1.2s ease-in-out;
  -o-transition: all 1.2s ease-in-out;
  transition: all 1.2s ease-in-out;
  right: 0;
}

.chart--horizontal .bar.bar--danger { background-color: #a0c85a; }

/*------------------------------------*\
    # Others
\*------------------------------------*/

.chart__header { margin-bottom: 10px; }

@media screen and (min-width: 768px) {

.chart__header { margin-bottom: 70px; }

.chart--left .chart__header, .chart--right .chart__header { margin-bottom: 40px; }

}

@media screen and (min-width: 768px) {

.chart__filters--big {
  position: absolute;
  right: 5px;
  top: 0;
  padding: 35px 15px;
}

}

.chart__legend {
  margin: 30px 10px 0;
  padding: 0;
  list-style: none;
  color: rgba(0, 0, 0, 0.6);
  font-size: 14px;
}
 @media screen and (min-width: 768px) {

.chart__legend { margin: 30px 10px 0 20px; }
}

.chart__legend li {
  position: relative;
  padding: 0 10px 10px 15px;
}

.chart__legend span {
  display: inline-block;
  height: 15px;
  width: 15px;
  position: absolute;
  left: -10px;
  top: -3px;
  vertical-align: middle;
  margin: 5px 10px 8px 0;
}

@media screen and (min-width: 1024px) {

.chart--left { margin-right: 15px; }

}

@media screen and (min-width: 1024px) {

.chart--right { margin-left: 15px; }

}

.chart__btn.btn--read-more {
  top: 15px;
  display: block;
  z-index: 4;
}

@media screen and (min-width: 768px) {

.chart__btn.btn--read-more { top: 25px; }

}

.chart__btn.btn--read-more .hide { display: none; }

.chart {
  position: relative;
  max-height: 150px;
  margin-bottom: -70px;
  overflow: hidden;
  -webkit-transition: all 0s ease-in-out;
  -ms-transition: all 0s ease-in-out;
  -moz-transition: all 0s ease-in-out;
  -o-transition: all 0s ease-in-out;
  transition: all 0s ease-in-out;
}

.chart .chart__container {
  -webkit-transition: all 1s ease-in-out;
  -ms-transition: all 1s ease-in-out;
  -moz-transition: all 1s ease-in-out;
  -o-transition: all 1s ease-in-out;
  transition: all 1s ease-in-out;
  opacity: 0;
}

.chart:before {
  content: '';
  background-image: linear-gradient(to bottom, rgba(238, 238, 238, 0.5) 0%, #fff 100px);
  background-repeat: repeat-x;
  position: absolute;
  top: 0;
  left: 0;
  right: 0;
  bottom: 0;
  z-index: 3;
}

.chart.active {
  max-height: 2000px;
  overflow: visible;
  padding-bottom: 60px;
  margin-bottom: 0;
  color: #000;
  -webkit-transition: all 1s ease-in-out;
  -ms-transition: all 1s ease-in-out;
  -moz-transition: all 1s ease-in-out;
  -o-transition: all 1s ease-in-out;
  transition: all 1s ease-in-out;
}

@media screen and (min-width: 768px) {

.chart.active { padding-bottom: 100px; }

}

.chart.active .chart__container { opacity: 1; }

.chart.active:before { display: none; }

.chart.active .chart__btn {
  position: absolute;
  bottom: 15px;
  left: 0;
  right: 0;
  top: auto;
}
5. Plugin's default options.
$('#default-chart').horizontalChart({
  data: {},
  animation: true,
  animationOffset: 0,
  animationRepeat: true,
  showValues: true,
  showArrows: false,
  showHorizontalLines: false,
  labelsAboveBars: false
});
6. API methods.
// Initialization horizontal chart.
var $myChart = $('#default-chart').rumcaJS(options);

// Remove all data.
$myChart.resetAll();

// Remove all bars.
$myChart.resetBars();

// Remove all data from axis Y.
$myChart.resetAxisY();

// Remove all data from axis X.
$myChart.resetAxisX();

// Remove single item.
// Parameter: int value (from the top, starting on 1).
$myChart.removeItem(4);

// Insert all data.
// Parameter: object with data.
$myChart.appendAll(data);

// Insert an element to the end.
// Parameters: string value (for axis Y label), int value (for bar).
$myChart.appendItem('new item', 33);

// Insert a bars to the end.
// Parameter: array with int value.
$myChart.appendBars(barsValue);

// Insert an axis Y value to the end.
// Parameter: array with string value.
$myChart.appendAxisY(axisY);

// Insert an axis X value to the ending.
// Parameter: array with string value.
$myChart.appendAxisX(axisX);

// Insert all data.
// Parameter: object with data.
$myChart.prependAll(data);

// Insert an element to the beginning.
// Parameters: string value (for axis Y label), int value (for bar).
$myChart.prependItem('new item', 76);

// Insert a bars on the beginning.
// Parameter: array with int value.
$myChart.prependBars(barsValue);

// Insert an axis Y value to the beginning.
// Parameter: array with string value.
$myChart.prependAxisY(axisY);

// Insert an axis X value to the beginning.
// Parameter: array with string value.
$myChart.prependAxisX(axisX);

// Update chart with new data.
// Parameter: object with new data.
$myChart.updateAll(data);

// Update a bars.
// Parameter: array with int value.
$myChart.updateBars(barsValue);

// Update an axis Y.
// Parameter: array with string value.
$myChart.updateAxisY(axisY);

// Update an axis X.
// Parameter: array with string value.
$myChart.updateAxisX(axisX);

// Sort by name.
// Parameter: boolean value (true - descending, false - ascending).
$myChart.sortByName(true);

// Sort by value.
// Parameter: boolean value (true - descending, false - ascending).
$myChart.sortByValue(false);

// Select bar with maxiumum value.
$myChart.selectMax();

// Select bar with minimum value.
$myChart.selectMin();

// Animation trigger.
$myChart.runAnimation();
Change logs:
2016-02-14
- SortBy method - improvements
- Option - repeat animation
2016-02-10
- Horizontal line added
This awesome jQuery plugin is developed by sebastianmusial. For more Advanced Usages, please check the demo page or visit the official website.


