Responsive Animated Column Chart Plugin - Draw Bar Chart
| File Size: | 13 KB |
|---|---|
| Views Total: | 1273 |
| Last Update: | |
| Publish Date: | |
| Official Website: | Go to website |
| License: | MIT |

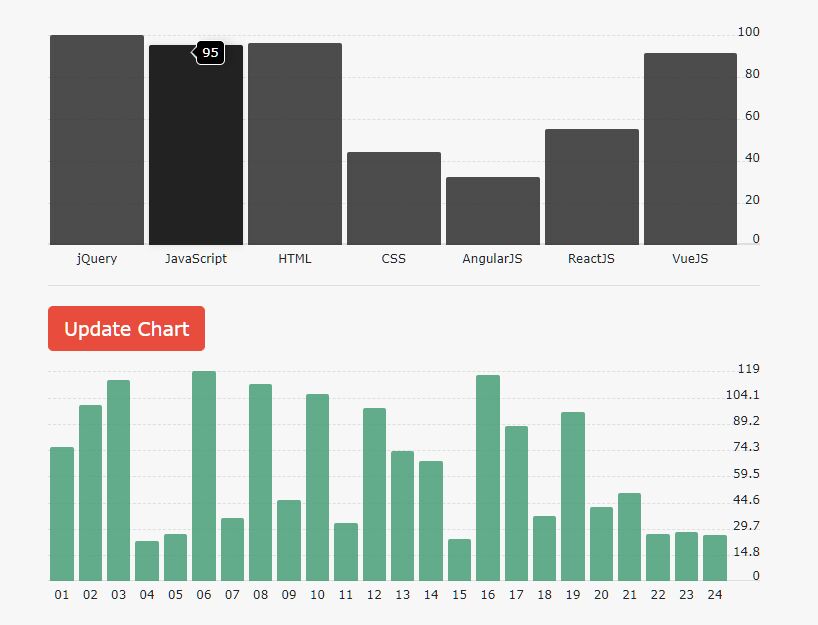
Draw Bar Chart is a responsive and animated jQuery bar (column) chart plugin for drawing single-bar or stacked-bar charts on the page.
Based on pure JavaScript, HTML, and CSS/CSS3. No SVG and Canvas needed.
You can customize almost every aspect of the chart: adjust the size of the chart, change colors, enable/disable animations, and change its look by adding axes, labels, and legends.
How to use it:
1. Load the stylesheet draw-bar-chart.css and JavaScript draw-bar-chart.js in the document.
<!-- jQuery Is Required -->
<script src="/path/to/cdn/jquery.min.js"></script>
<!-- Draw Bar Chart -->
<script src="./draw-bar-chart.js"></script>
<link href="./draw-bar-chart.css" rel="stylesheet" />
2. Create an empty container to hold the bar chart.
<div id="example"></div>
3. Initialize the plugin and define your own data to be visualized in the bar chart.
drawBarChart(
  $("#example"),
  {
    // values
    values: [3.6, 4.9, 3.8, 2.5, 6.5],
    // x-axis labels
    labels: ["jQuery", "Script", "Net", "CSS", "Com"],
  },
  {
    // chart ID
    id: 1,
    // chart title
    chartTitle: "Basic Chart",
    // y-axis title
    yAxisTitle: "y-axis title",
    // x-axis title
    xAxisTitle: "x-axis title",
  }
);
4. Negative values are supported as well.
drawBarChart(
  $("#example"),
  {
    // values
    values: [-1.25, -6.21, 4.04, 1.98, -2.5],
  },
  {
    // ...
  }
);
5. Generate a stacked bar chart from an array of arrays.
drawBarChart(
  $("#example"),
  {
    values: [
      [1, 2, 3],
      [-1, 2, 3],
      [3.5, 1, -4],
      [1, 0.5, -3],
      [-2.5, 3, -1],
    ],
    labels: ["A", "B", "C", "D", "E"],
    stackLabels: ["label1", "label2", "label3"],
  },
  {
    // ...
  }
);
6. Full plugin options to customize the bar chart.
drawBarChart(
  $("#example"),
  {
    // data here
  },
  {

    // tick interval
    tickInterval: 2,

    // chart width
    width: "90vw",

    // chart height
    height: "90vh",

    // font size of chart title
    titleFontSize: "2em",

    // color of chart title
    titleColour: "black",

    // font size of y-axis title
    yAxisTitleFontSize: "1.5em",

    // color of y-axis label
    yAxisLabelFontSize: "1.5em",

    // font size of x-axis title
    xAxisTitleFontSize: "1.5em",

    // color of x-axis label
    xAxisLabelFontSize: "1.5em",

    // "top", "centre" or "bottom"
    dataLabelPosition: "top",

    // color of data label
    dataLabelColour: "white",

    // font size of data label
    dataLabelFontSize: "1em",

    // For single bar chart: String
    // For stacked bar chart: Array of String
    barColour: "SkyBlue",

    // space between bars
    barSpacing: "1em",

    // whether to show legend
    showLegend: true,

    // font size of stack label
    stackLabelFontSize: "1.1em",

    // color of stack label
    stackLabelColour: "black",

    // allows users to select values
    userSelect: false,

    // displays values as scientific notation
    scientificNotation: false,

    // enable/disable animation
    animationEffect: true,

  }
);
Changelog:
2022-01-07
- fill in the stacked labels when the label are not enough
This awesome jQuery plugin is developed by scc416. For more Advanced Usages, please check the demo page or visit the official website.