Generate Animated Column Charts From JS Array - Simple Bar Graph
| File Size: | 21.4 KB |
|---|---|
| Views Total: | 4870 |
| Last Update: | |
| Publish Date: | |
| Official Website: | Go to website |
| License: | MIT |
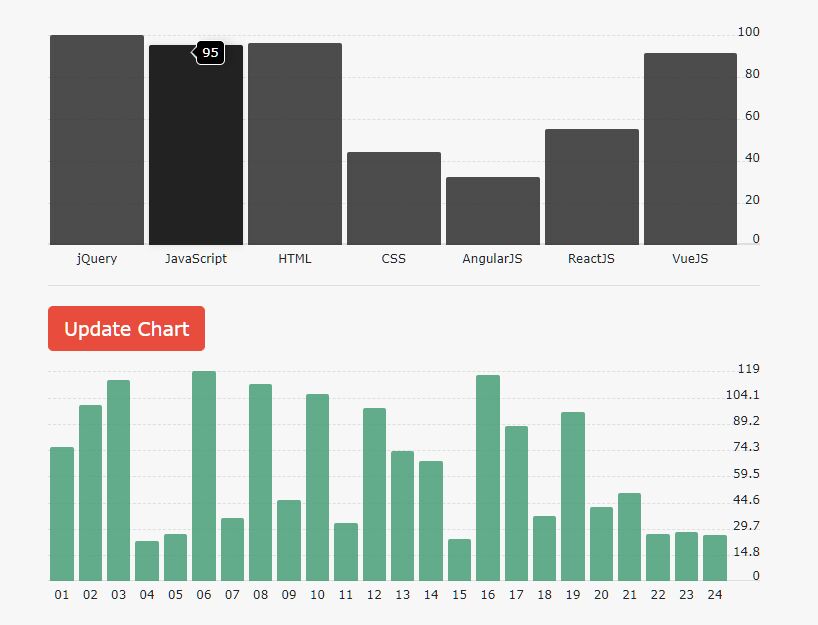
A simple bar graph jQuery plugin (~2kb minified) that takes data from a JavaScript array containing keys and values and converting them into an animated column chart.
More Features:
- X & Y axis labels.
- Tooltip showing the value when you hover over.
- Allows you to specify the number of rows.
- Fully responsive and easy to use.
How to use it:
1. Load the minified version of the simple bar graph plugin after jQuery library.
<!-- Required Stylesheet -->
<link rel="stylesheet" href="dist/css/jquery.simple-bar-graph.min.css" />
<!-- Required JavaScript -->
<script src="/path/to/cdn/jquery.min.js"></script>
<script src="dist/js/jquery.simple-bar-graph.min.js"></script>
2. Create a container to hold the column chart.
<div id="example">Loading...</div>
3. Prepare your data to be plotted into the chart.
const myData = [
      { key: 'jQuery', value: 100 },
      { key: 'JavaScript', value: 95 },
      { key: 'HTML', value: 96 },
      { key: 'CSS', value: 44 },
      { key: 'AngularJS', value: 32 },
      { key: 'ReactJS', value: 130 },
      { key: 'VueJS', value: 91 }
],
4. Call the plugin to render a basic column chart on the page.
$('#example').simpleBarGraph({
  data: myData
});
5. Customize the background color of the bars (columns).
$('#example').simpleBarGraph({
  data: myData,
  barsColor: '#222'
});
6. Determine the height of the column chart. Default: 300px.
$('#example').simpleBarGraph({
  data: myData,
  height: '400px'
});
7. Determine whether to show the tooltip. Default: true.
$('#example').simpleBarGraph({
  data: myData,
  popups: false
});
8. Customize the rows of the column chart.
$('#example').simpleBarGraph({
  data: myData,
  rowsCount: 5,
  rowCaptionsWidth: '16px'
});
9. Determine the transition delay. Default: 20
$('#example').simpleBarGraph({
  data: myData,
  delayAnimation: 10
});
Changelog:
2020-06-16
- moved transition-delay to options
This awesome jQuery plugin is developed by maximzhurkin. For more Advanced Usages, please check the demo page or visit the official website.


