Single & Stacked Horizontal Bar Chart Plugin - jQuery barChart
| File Size: | 10.2 KB |
|---|---|
| Views Total: | 1344 |
| Last Update: | |
| Publish Date: | |
| Official Website: | Go to website |
| License: | MIT |
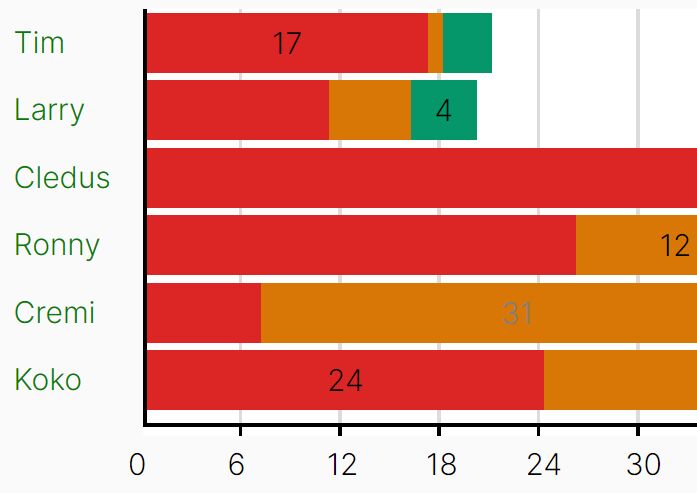
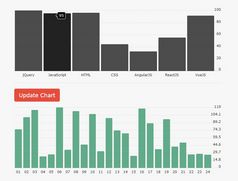
A bar chart is one of the most common ways for displaying data graphically. It's easy to read, gives a quick and general overview of a data set.
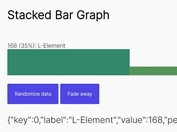
In this article I will introduce you to a brand new plugin called barChat that can be used to create single or stacked horizontal bar charts from data sets defined in a JS array. Have fun.
How to use it:
1. Create a container to hold the bar chart.
<div class="chart" id="graph">

</div>
2. Define your data in a JS array of objects as follows:
// single bar chart
const myData = [
  {
    'value': [17],
    'color' :[], // bar colors
    'labelColor' :['black'],
    'barLabel': 'Label 1'
  },
  // ... more data here
];

// stacked bar chart
const myData = [
  {
    'value': [17,1,3],
    'color' :['red','yellow','green'],
    'labelColor' :['black'],
    'barLabel': 'Label 1'
  },
  // ... more data here
];
3. Load the barGraph.js after jQuery.
<script src="/path/to/cdn/jquery.slim.min.js"></script>
<script src="/path/to/barGraph.js"></script>
4. Customize the bar chart with the following options.
const myOptions = {
      // in pixels
      width: 500,
      height: 300,
      barSpacing: 4,
      graphFont: 16,
      // bottom, center, top
      barLabelPosition: 'center',
      yLableColor: 'green',
      backgroundBarColor: 'rgb(100,255,255)',
      titleFont: {size: 24, color: "black"},
      title: "Saying Thanks!",
      xAxisTitle: 'Average thank you\'s per day',
      xAxisTitleFont: {size: 24, color: "black"},
      // max value
      xMax: 60,
      // tick steps
      xsteps: 6
};
5. Initialize the plugin and draw a horizontal bar chart from the data set you provide.
let myChart = $("#graph");
drawBarChart(myData, myOptions, myChart);
This awesome jQuery plugin is developed by p00kO. For more Advanced Usages, please check the demo page or visit the official website.
