Simple SVG Flow Chart Plugin with jQuery - flowSVG
| File Size: | 109 KB |
|---|---|
| Views Total: | 59987 |
| Last Update: | |
| Publish Date: | |
| Official Website: | Go to website |
| License: | MIT |
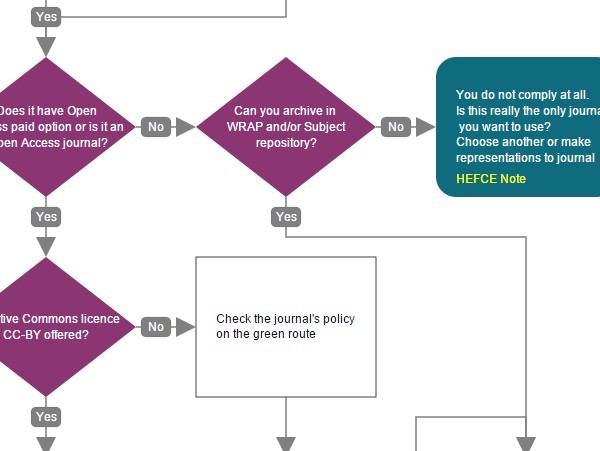
flowSVG is a jQuery diagram plugin that uses SVG.js to draw interactive and statistic flow charts for representing algorithms, workflows or processes.
See also:
Based usage:
1. Load the necessary jQuery library and SVG.js in your project.
<script src="//ajax.googleapis.com/ajax/libs/jquery/2.1.3/jquery.min.js"></script>
<script src="//cdnjs.cloudflare.com/ajax/libs/svg.js/1.0.1/svg.min.js"></script>
2. Load the flowSVG jQuery plugin after jQuery library.
<script src="dist/flowsvg.min.js"></script>
3. Load the jQuery scrollTo plugin for interactive flow charts.
<script src="jquery.scrollTo.min.js"></script>
4. Create a container for the flow chart.
<div id="drawing"></div>
5. Add your steps & flow shapes in the javascript as follows.
flowSVG.draw(SVG('demo').size(600, 800));
flowSVG.config({
    interactive: true,
    showButtons: true,
    connectorLength: 60,
    scrollto: true
    // more options...
});
flowSVG.shapes(
  [{
    // The label is how the shape is identified
    label: 'knowPolicy',

    // Type may be decision, finish, or process
    type: 'decision',

    /*
    text is an array of lines. SVG text doesn't
    wrap, so you have to manually adjust line length
    */
    text: [
      'Do you know the ',
      'Open Access policy',
      'of the journal?'
    ],

    /*
    Where to go from here. 'yes' and 'no' apply to
    decisions. 'next' is used with processes.
    These don't apply to finish shapes for obvious
    reasons.
    */
    yes: 'hasOAPolicy',
    no: 'checkPolicy'
    // If this was a process...
    // next: ...
  },
  // more shapes...
]);
6. Configuration options.
// Shape width
w: 200,

// Shape height
h: 180,

// The following are self-explanatory
connectorLength: 100,
connectorStrokeWidth: 3,
arrowColour: 'lightgrey',
decisionFill: 'firebrick',
processFill: 'navajowhite',
finishFill: 'seagreen',
defaultFontSize: '14',

/*
By default the chart loads in interactive mode.
Change to false to load the static view first
*/
interactive: false,

/*
Buttons are shown by default. Set to false to
hide them
*/
showButtons: false,

// Disable scrolling to off screen elements
scrollto: true
This awesome jQuery plugin is developed by rtalbot89. For more Advanced Usages, please check the demo page or visit the official website.
