jQuery Plugin For Generating Google Charts From Tables - Chartinator
| File Size: | 461 KB |
|---|---|
| Views Total: | 7634 |
| Last Update: | |
| Publish Date: | |
| Official Website: | Go to website |
| License: | MIT |
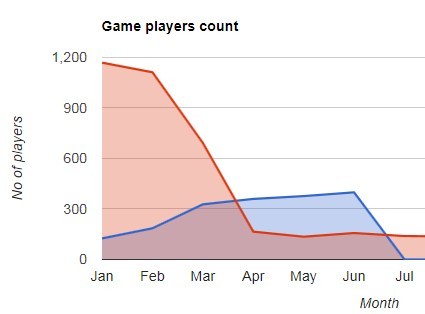
Chartinator is a jQuery data visualization plugin that makes use of Google Charts to render a variety of charts from existing table content. License: GPL v3.
See also:
- jQuery Plugin To Generate Google charts From tables - gvchart
- jQuery Plugin To Render A Bar chart From A table - table Barchart
- jQuery Plugin To Convert table To Highcharts Graph - Highcharts Maker
How to use it:
1. Include the jQuery Chartinator plugin after loading jQuery library.
<script src="//code.jquery.com/jquery-1.11.2.min.js"></script>
<script src="js/chartinator.js" ></script>
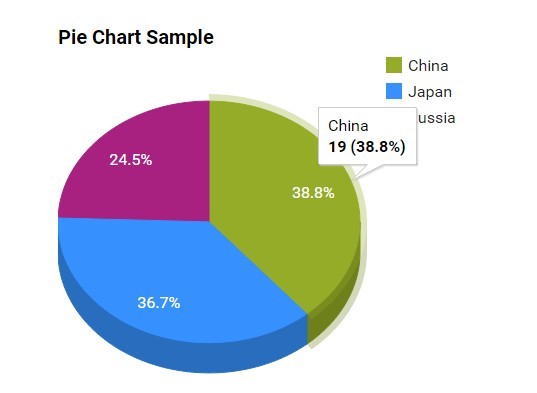
2. The th elements in HTML table must have one of the following 'data-type' attributes: 'string' 'number' 'boolean' 'date' 'datetime' 'timeofday' or custom values: 'tooltip'. * The caption element's text is used as a title for the chart by default.
<table id="myTable" class="barChart data-table">
  <caption>Student Nationalities Table</caption>
  <tr>
      <th scope="col" data-type="string">Country</th>
      <th scope="col" data-type="number">Number of Students</th>
  </tr>
  <tr>
      <td>Bulgaria</td>
      <td align="right">1</td>
  </tr>
  <tr>
      <td>China</td>
      <td align="right">19</td>
  </tr>
  <tr>
      <td>Colombia</td>
      <td align="right">5</td>
  </tr>
  <tr>
      <td>France</td>
      <td align="right">3</td>
  </tr>
  ...
</table>
3. Call the plugin to generate a bar chart using Google Charts.
var chart1 = $('#barChart').chartinator({

// The jQuery selector of the HTML table element to extract the data from - String
// Default: false
// If unspecified, the element this plugin is applied to must be the HTML table
tableSel: '.barChart',

// The chart type - String
// Default: 'BarChart'
// Options: BarChart, PieChart, ColumnChart, Calendar, GeoChart, Table.
chartType: 'BarChart',

// Google Bar Chart Options
barChart: {
   ...
},

// Show table as well as chart - String
// Options: 'show', 'hide', 'remove'
showTable: 'show'

});
4. Full plugin options.
// The path to the Google AJAX API
urlJSAPI: 'https://www.google.com/jsapi',

// The data columns js array
// Default: false
columns: false,

// Column indexes array - An array of column indexes defining where
// the data will be inserted into any existing data extracted from an HTML table
// Default: false - js data array columns replace any existing columns
// Note: when inserting more than one column be sure to increment index number
// to account for previously inserted indexes
colIndexes: false,

// Rows - The rows data-array
// If colIndexes array has values the row data will be inserted into the columns
// defined in the colindexes array. Otherwise the row data will be appended
// to any existing row data extracted from an HTML table
// Default: false
rows: false,

// The jQuery selector of the HTML table element to extract the data from.
// Default: false - Chart extracts data and replaces the HTML table(s) selected above
tableSel: false,

// Ignore column indexes array - An array of column indexes to ignore in the HTML table
// Default: []
// Note: Only works when extracting data from HTML tables
ignoreCol: [],

// The tooltip concatenation - Defines a string for concatenating a custom tooltip.
// Keywords: 'domain', 'data', 'label' - these will be replaced with current values
// 'domain': the primary axis value, 'data': the data value, 'label': the column title
// Default: false - use Google Charts tooltip defaults
// Note: Only works when extracting data from HTML tables
// Not supported on pie, calendar charts
tooltipConcat: false,

// The annotation concatenation - Defines a string for concatenating a custom annotation.
// Keywords: 'domain', 'data', 'label' - these will be replaced with current values
// 'domain': the primary axis value, 'data': the data value, 'label': the column title
// Default: false - use Google Charts annotation defaults
// Note: Only works when extracting data from HTML tables.
// Not supported on pie, geo, calendar charts
annotationConcat: false,

// The chart type - Options: BarChart, PieChart, ColumnChart, Calendar, GeoChart, Table.
// Default: 'BarChart'
chartType: 'BarChart',

// The class to apply to the dynamically created chart container element
chartClass: 'chtr-chart',

// The chart height aspect ratio custom option
// Used to refactor the chart height relative to the width in responsive designs
// this is overridden if the Google Charts height option has a value
// Default: false - not used
chartHeightRatio: false,

// Google Bar Chart Options
barChart: {

  // The font size in pixels - Number
  // Or use css selectors as keywords to assign font sizes from the page
  // For example: 'body'
  // Default: false - Use Google Charts defaults
  fontSize: false,

  chartArea: { left: "20%", top: 40, width: "75%", height: "85%" },
  fontName: o.fontFamily,
  legend: { position: 'bottom' }
},

// Google Pie Chart Options
pieChart: {

  // The font size in pixels - Number
  // Or use css selectors as keywords to assign font sizes from the page
  // For example: 'body'
  // Default: false - Use Google Charts defaults
  fontSize: false,

  chartArea: { left: 0, top: 0, width: "100%", height: "100%" },
  fontName: o.fontFamily
},

// Google Column Chart Options
columnChart: {

  // The font size in pixels - Number
  // Or use css selectors as keywords to assign font sizes from the page
  // For example: 'body'
  // Default: false - Use Google Charts defaults
  fontSize: false,

  fontName: o.fontFamily,
  legend: { position: 'bottom' }
},

// Google Geo Chart Options
geoChart: {

},

// Google Calendar Chart Options
calendarChart: {

  // The cell scaling factor custom option - Not a Google Chart option
  // Used to refactor the cell size in responsive designs
  // this is overridden if the calendar.cellSize option has a value
  cellScaleFactor: 0.017,

  calendar: {
      monthLabel: {

        // The font size in pixels - Number
        // Or use css selectors as keywords to assign font sizes from the page
        // For example: 'body'
        // Default: false - Use Google Charts defaults
        fontSize: false,

        fontName: o.fontFamily
      },
      dayOfWeekLabel: {

        // The font size in pixels - Number
        // Or use css selectors as keywords to assign font sizes from the page
        // For example: 'body'
        // Default: false - Use Google Charts defaults
        fontSize: false,

        fontName: o.fontFamily
      }
  }
},

// Google Table Chart Options
tableChart: {

  // Format a data column in a Table Chart
  formatter: {

    // Formatter type - Options: 'none', 'BarFormat'
    type: 'none',

    // The index number of the column to format. Options: 0, 1, 2, etc.
    column: 1
  },

  // Allow HTML in cells. default: false
  allowHtml: true,

  cssClassNames: {
    headerRow: 'headerRow',
    tableRow: 'tableRow',
    oddTableRow: 'oddTableRow',
    selectedTableRow: 'selectedTableRow',
    hoverTableRow: 'hoverTableRow',
    headerCell: 'headerCell',
    tableCell: 'tableCell',
    rowNumberCell: 'rowNumberCell'
  }
},

// Show table along with chart. String, Options: 'show', 'hide', 'remove'
showTable: 'hide',

// The CSS to apply to show or hide the table and chart
showTableCSS: { 'position': 'static', 'top': 0, 'width': '' },
hideTableCSS: { 'position': 'absolute', 'top': '-9999px', 'width': $tableS.width() },
showChartCSS: {  },
hideChartCSS: { 'opacity': 0 }
Change logs:
2015-06-16
- v0.3.10
2015-05-08
- v0.3.9
2015-04-14
- v0.3.8
2015-03-27
- Options update.
2015-03-25
- v0.2.2
This awesome jQuery plugin is developed by jbowyers. For more Advanced Usages, please check the demo page or visit the official website.