jQuery Plugin To Convert Table To Highcharts Graph - Highcharts Maker
| File Size: | 57.7 KB |
|---|---|
| Views Total: | 6109 |
| Last Update: | |
| Publish Date: | |
| Official Website: | Go to website |
| License: | MIT |
Highcharts Maker is a lightweight jQuery plugin used to generate an intuitive, interactive, responsive chart from table data, requires the popular Highcharts.js library.
How to use it:
1. Load the required jQuery library and highcharts.js in the html document.
<script src="http://ajax.googleapis.com/ajax/libs/jquery/2.1.0/jquery.min.js"></script>
<script type="text/javascript" src="highcharts.js"></script>
2. Make sure to load the jQuery highcharts maker plugin after jQuery library.
<script type="text/javascript" src="jquery.highchartsmaker.js"></script>
3. Create an empty container element to present the chart.
<div id="chart"></div>
4. Create a standard Html table with sample data.
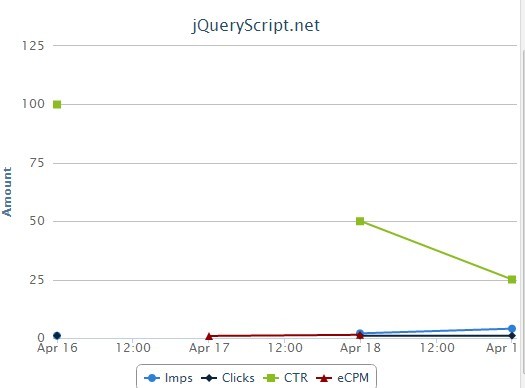
<table id="data">
<thead>
<tr>
<th>Date</th>
<th>Imps</th>
<th>Clicks</th>
<th>CTR</th>
<th>eCPM</th>
</tr>
</thead>
<tbody>
<tr>
<td>Apr 16, 2012</td>
<td>1</td>
<td>1</td>
<td>100%</td>
<td></td>
</tr>
<tr>
<td>Apr 18, 2012</td>
<td>2</td>
<td>1</td>
<td>50%</td>
<td>$0.88</td>
</tr>
<tr>
<td>Apr 19, 2012</td>
<td>4</td>
<td>1</td>
<td>25%</td>
<td>$1.37</td>
</tr>
</tbody>
</table>
5. Call the plugin to generate a chart.
<script type="text/javascript">
$(function() {
$('#chart').highchartsMaker($('#data'), {
OPTIONS
});
});
</script>
6. All the default settings.
<script type="text/javascript">
$(function() {
$('#chart').highchartsMaker($('#data'), {
title: "Untitled",
subtitle: "",
yAxis: {
    min: 0
},
date_only: false,
group_by: false,
reverse: false,
date_interval: 0,
iterator: 'none'
});
});
</script>
Change log:
2016-02-01
- bugfix for skipping dates
This awesome jQuery plugin is developed by devdaniel. For more Advanced Usages, please check the demo page or visit the official website.