Easy Responsive Gantt Chart With jQuery And Moment.js
| File Size: | 6.86 KB |
|---|---|
| Views Total: | 7338 |
| Last Update: | |
| Publish Date: | |
| Official Website: | Go to website |
| License: | MIT |
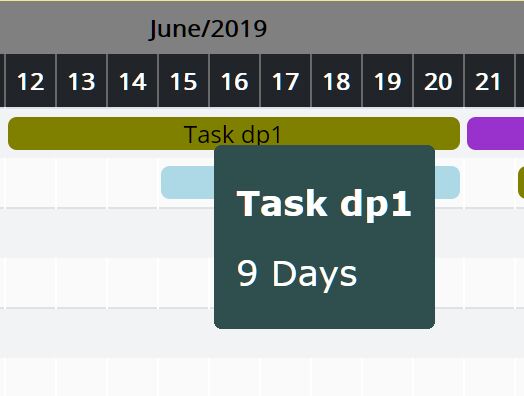
easy-gantt is an easy responsive, dynamic, scrollable, multi-language Gantt chart plugin designed for planning, viewing, tracking tasks in a project.
Built with jQuery and moment.js.
How to use it:
1. Load the necessary JavaScript libraries from CDN.
<script src="/path/to/cdn/jquery.slim.min.js"></script>
<script src="/path/to/cdn/moment-with-locales.min.js"></script>
2. Load the easy-gantt plugin's JavaScript and CSS files in the HTML page.
<link href="easy-gantt/easy-gantt.css" rel="stylesheet" />
<script src="easy-gantt/easy-gantt.js"></script>
3. Define your tasks containing ID, titles, names, colors, and start/end dates in the JavaScript.
var myTask = [
    {
        id: 10,
        name: 'Task 1',
        title: 'Title 1',
        date_start: '2019-05-09',
        date_end: '2019-06-10',
        color: '#ADFF2F',
    },
    {
        id: 11,
        name: 'Task 2',
        date_start: '2019-06-15',
        date_end: '2019-06-20',
        color: '#ADD8E6',
    },
    {
        id: 12,
        name: 'Task 3',
        date_start: '2019-07-05',
        date_end: '2019-07-15',
        color: '#FFDAB9',
    },
    {
        id: 13,
        name: 'Task 4',
        date_start: '2019-07-16',
        date_end: '2019-07-18',
        color: '#BC8F8F',
    },
    {
        id: 14,
        name: 'Task 5',
        date_start: '2019-07-20',
        date_end: '2019-07-23',
        color: '#9932CC'
    },
    {
        id: 15,
        name: 'Task 6',
        date_start: '2019-07-25',
        date_end: '2019-07-28',
        color: '#808000'
    }
];
4. Create an element to hold the gantt chart.
<div id="myChart"></div>
5. Render the data in the gantt chart.
$('#myGantt').gantt({
  data: myTask
});
6. Set the start/end dates of the gantt chart.
$('#myGantt').gantt({
  data: myTask,
  dtStart: '2019-05-05',
  dtEnd: '2019-09-05'
});
7. Set the height/width of the gantt chart.
$('#myGantt').gantt({
  data: myTask,
  width: 500, // default auto
  height: 400
});
8. Handle the click event on the task.
$('#myGantt').gantt({
  data: myTask,
  click: function(taskId, taskName, taskCountDays){
    console.log('task', taskId, taskName, taskCountDays);
  }
});
9. Set the local.
$('#myGantt').gantt({
  data: myTask,
  locale: 'pt-BR'
});
10. Determine whether to show the task names. Default: false.
$('#myGantt').gantt({
  data: myTask,
  labelTask: true
});
11. Correct the first column in the gantt chart. Default: 205 (px).
$('#myGantt').gantt({
  data: myTask,
  widthCorrectionFirstCol: 100
});
This awesome jQuery plugin is developed by tiagotsc. For more Advanced Usages, please check the demo page or visit the official website.