Graphical Gauge Meter With jQuery and Dx.js
| File Size: | 6.75 KB |
|---|---|
| Views Total: | 16249 |
| Last Update: | |
| Publish Date: | |
| Official Website: | Go to website |
| License: | MIT |
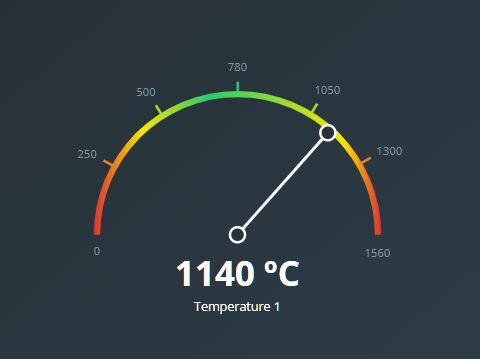
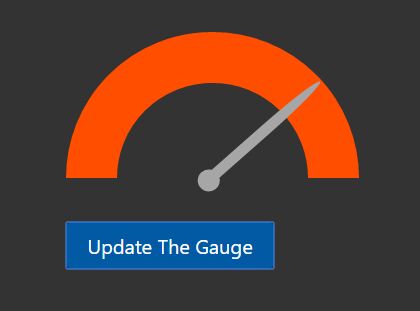
An elegant, animated, graphical gauge meter/chart that uses jQuery and dx.js libraries for SVG drawing.
Playground:
How to use it:
1. Load the needed JavaScript libraries in the document.
<script src="jquery.min.js"></script>
<script src="dx.all.js"></script>
2. The main function to generate a Gauge. Don't forget to override the options & settings as displayed betlow.
class GaugeChart {
  constructor(element, params) {
    this._element = element;
    this._initialValue = params.initialValue;
    this._higherValue = params.higherValue;
    this._title = params.title;
    this._subtitle = params.subtitle;
  }

  _buildConfig() {
    let element = this._element;

    return {
      value: this._initialValue,
      valueIndicator: {
        color: '#fff'
      },
      geometry: {
        startAngle: 180,
        endAngle: 360
      },
      scale: {
        startValue: 0,
        endValue: this._higherValue,
        customTicks: [0, 250, 500, 780, 1050, 1300, 1560],
        tick: {
          length: 8
        },
        label: {
          font: {
            color: '#87959f',
            size: 9,
            family: '"Open Sans", sans-serif'
          }
        }
      },
      title: {
        verticalAlignment: 'bottom',
        text: this._title,
        font: {
          family: '"Open Sans", sans-serif',
          color: '#fff',
          size: 10
        },
        subtitle: {
          text: this._subtitle,
          font: {
            family: '"Open Sans", sans-serif',
            color: '#fff',
            weight: 700,
            size: 28
          }
        }
      },
      onInitialized: function() {
        let currentGauge = $(element);
        let circle = currentGauge.find('.dxg-spindle-hole').clone();
        let border = currentGauge.find('.dxg-spindle-border').clone();

        currentGauge.find('.dxg-title text').first().attr('y', 48);
        currentGauge.find('.dxg-title text').last().attr('y', 28);
        currentGauge.find('.dxg-value-indicator').append(border, circle);
      }

    }
  }

  init() {
    $(this._element).dxCircularGauge(this._buildConfig());
  }
}
3. Create a container element to hold the gauge meter.
<div class="gauge"></div>
4. The necessary CSS/CSS3 styles for the gauge meter.
.gradient-mask {
  visibility: hidden;
}

.gauge-container {
  padding: 20px;
  margin-top: 80px;
  display: flex;
  justify-content: space-around;
}

.gauge {
  height: 220px;
  width: 300px;
}

.gauge .dxg-range.dxg-background-range {
  fill: url(#gradientGauge);
}

.gauge .dxg-line {
  -webkit-transform: scaleX(1.04) scaleY(1.03) translate(-4px, -4px);
          transform: scaleX(1.04) scaleY(1.03) translate(-4px, -4px);
}

.gauge .dxg-line path:first-child,
.gauge .dxg-line path:last-child {
  display: none;
}

.gauge .dxg-line path:nth-child(2),
.gauge .dxg-line path:nth-child(6) {
  stroke: #ed811c;
}

.gauge .dxg-line path:nth-child(3),
.gauge .dxg-line path:nth-child(5) {
  stroke: #a7db29;
}

.gauge .dxg-line path:nth-child(4) {
  stroke: #25cd6b;
}

.gauge .dxg-elements text:first-child {
  -webkit-transform: translate(19px, 13px);
          transform: translate(19px, 13px);
}

.gauge .dxg-elements text:last-child {
  -webkit-transform: translate(-27px, 14px);
          transform: translate(-27px, 14px);
}

.gauge .dxg-value-indicator path {
  -webkit-transform: scale(1.2) translate(0, -5px);
          transform: scale(1.2) translate(0, -5px);
  -webkit-transform-origin: center center;
          transform-origin: center center;
}

.gauge .dxg-value-indicator .dxg-title {
  text-transform: uppercase;
}

.gauge .dxg-value-indicator .dxg-title text:first-child {
  -webkit-transform: translateY(5px);
          transform: translateY(5px);
}

.gauge .dxg-value-indicator .dxg-spindle-border:nth-child(4),
.gauge .dxg-value-indicator .dxg-spindle-hole:nth-child(5) {
  -webkit-transform: translate(0, -109px);
          transform: translate(0, -109px);
}

.gauge .dxg-value-indicator .dxg-spindle-hole {
  fill: #26323a;
}
5. The JQuery script to draw the gauge meter on the page.
$('.gauge').function(item){
  let params = {
    initialValue: -20,
    higherValue: 40,
    title: `Temperature`,
    subtitle: '22 ºC'
  };
  let gauge = new GaugeChart(item, params);
  gauge.init();
});
This awesome jQuery plugin is developed by Bruno Carvalho. For more Advanced Usages, please check the demo page or visit the official website.