Simple Plain Bar (Column) Chart In jQuery - bar-chart.js
| File Size: | 21.8 KB |
|---|---|
| Views Total: | 1733 |
| Last Update: | |
| Publish Date: | |
| Official Website: | Go to website |
| License: | MIT |
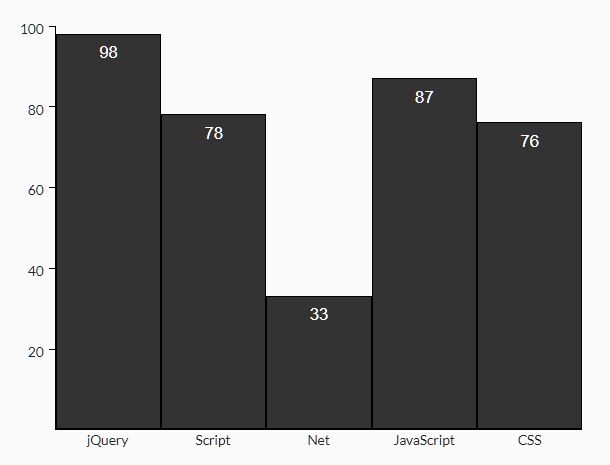
bar-chart.js is a tiny yet fully customizable jQuery chart plugin which helps you draw a plain vertical bar (column) chart form a JS array or an object containing key-value pairs.
How to use it:
1. Create a container element for the bar chart.
<div id="my-bar-chart"></div>
2. Insert the bar-chart.js script after the latest jQuery library.
<script src="/path/to/cdn/jquery.min.js">
<script src="js/bar-chart.js"></script>
3. Prepare your data to be plotted to the bar chart.
// data array
const myData = [ 1, 2, 3, 4, 5 ]

// with custom labels
const myData = {
  'label-1': 5,
  'label-2': 3,
  'label-3': 4,
  'label-4': 1,
  'label-5': 2,
}
4. Draw a default bar chart inside the container element you just created.
drawBarChart(myData, {/* options here */}, $("#my-bar-chart"));
5. Customize the appearance of the bar chart with the following options.
drawBarChart(myData, myOptions, $("#my-bar-chart"));

const myOptions = {

      // Title options
      title: '' // chart title
      titleSize: '', // font size
      titleColor: '', // hex color or color name

      // Width/Height
      width: '500px',
      height: '300px',

      // x/y axis names
      xAxisName: '',
      yAxisName: '',

      // the position of the labels
      // "top" (default), "center", or "bottom"
      valueLabelPosition: 'top',

      // label color
      valueLabelColor: '',

      // bar color
      // also accepts color array for stacked bar chart
      barColor: 'blue',

      // space between bars
      barSpacing: '5px',

      // shows ticks
      showTicks: false

      // the absolute positioning of the legend
      legendPosition: { top: "0", left: "30px" }

}
This awesome jQuery plugin is developed by fapapa. For more Advanced Usages, please check the demo page or visit the official website.


