Morris - Good-looking Charts Plugin With jQuery
| File Size: | 135 KB |
|---|---|
| Views Total: | 57671 |
| Last Update: | |
| Publish Date: | |
| Official Website: | Go to website |
| License: | MIT |
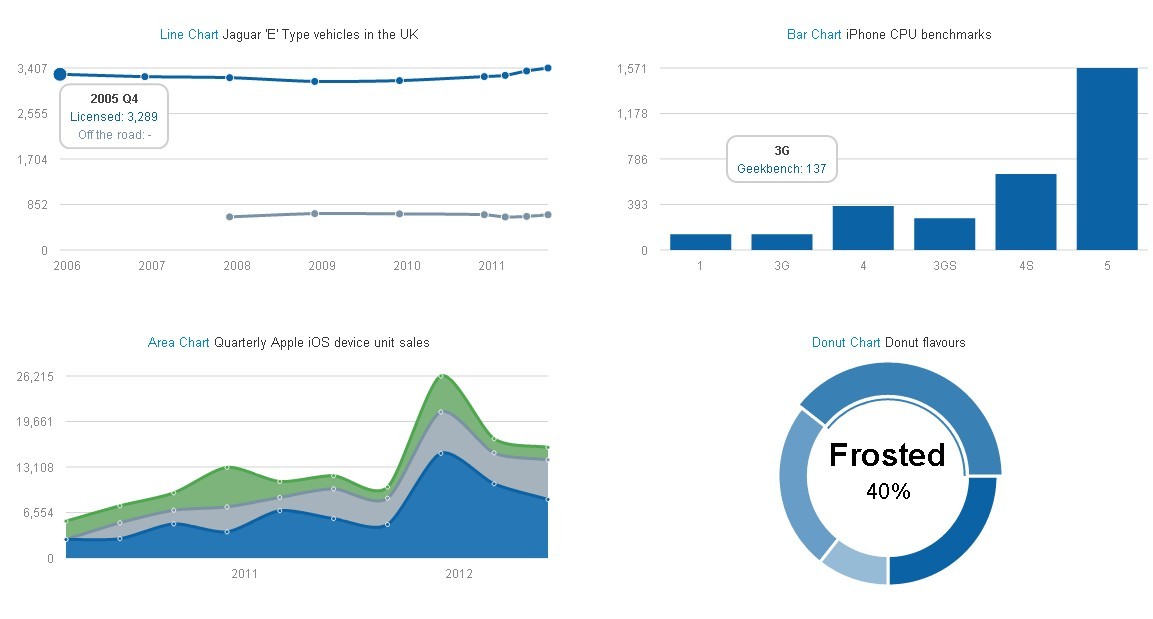
Morris is a pretty and powerful Charts Plugin with jQuery and Raphaël JS Library to make drawing simple charts easy. With Morris.js, you can create a wide variety of charts like line & area charts, bar charts and donut charts to fit you needs. It also works fine on mobile device such as iOS and android. More examples can be found in examples fold.
Basic Usage:
1. Include jQuery, Raphaël JS Library and Morris.js in the header
<script src="jquery.min.js"></script>
<script src="raphael-min.js"></script>
<script src="morris.js"></script>
2. Include required CSS file to style your charts
<link rel="stylesheet" href="morris.css">
3. Create a container for your charts
<div id="graph"></div>
4. The javascript to create a new area chart.
Morris.Area({
  element: 'graph',
  data: [
    {x: '2011 Q1', y: 3, z: 3},
    {x: '2011 Q2', y: 2, z: 0},
    {x: '2011 Q3', y: 2, z: 5},
    {x: '2011 Q4', y: 4, z: 4}
  ],
  xkey: 'x',
  ykeys: ['y', 'z'],
  labels: ['Y', 'Z']
}).on('click', function(i, row){
  console.log(i, row);
});
5. More chart types.
// bar chart
Morris.Bar(options)

// donut chart
Morris.Donut(options)

// line chart
Morris.Line(options)
6. All default options to customize the charts.
// line chart
Morris.Line({
  lineWidth: 3,
  pointSize: 4,
  lineColors: ['#0b62a4', '#7A92A3', '#4da74d', '#afd8f8', '#edc240', '#cb4b4b', '#9440ed'],
  pointStrokeWidths: [1],
  pointStrokeColors: ['#ffffff'],
  pointFillColors: [],
  smooth: true,
  shown: true,
  xLabels: 'auto',
  xLabelFormat: null,
  xLabelMargin: 24,
  hideHover: false,
  trendLine: false,
  trendLineWidth: 2,
  trendLineColors: ['#689bc3', '#a2b3bf', '#64b764']
})

// line chart
Morris.Area({
  fillOpacity: 'auto',
  behaveLikeLine: false
})

// Bar chart
Morris.Area({
  barSizeRatio: 0.75,
  barGap: 3,
  barColors: ['#0b62a4', '#7a92a3', '#4da74d', '#afd8f8', '#edc240', '#cb4b4b', '#9440ed'],
  barOpacity: 1.0,
  barRadius: [0, 0, 0, 0],
  xLabelMargin: 50,
  horizontal: false,
  shown: true
})

// Donut chart
Morris.Donut({
  colors: ['#0B62A4', '#3980B5', '#679DC6', '#95BBD7', '#B0CCE1', '#095791', '#095085', '#083E67', '#052C48', '#042135'],
  backgroundColor: '#FFFFFF',
  labelColor: '#000000',
  formatter: Morris.commas,
  resize: false
})
More examples:
Change log:
v0.5.1 (2016-07-07)
- Update
v0.4.3 (2013-05-26)
- Fix flickering hover box
- xLabelAngle option (diagonal labels!!)
- Fix area chart fill bug
- Make event handlers chainable
- gridTextFamily and gridTextWeight options
- Fix hovers with setData
- Fix hideHover behaviour
This awesome jQuery plugin is developed by oesmith. For more Advanced Usages, please check the demo page or visit the official website.
- Prev: None
- Next: JavaScript Charts With SVG – xCharts


