JavaScript Charts With SVG – xCharts
| File Size: | 57.8 KB |
|---|---|
| Views Total: | 5518 |
| Last Update: | |
| Publish Date: | |
| Official Website: | Go to website |
| License: | MIT |
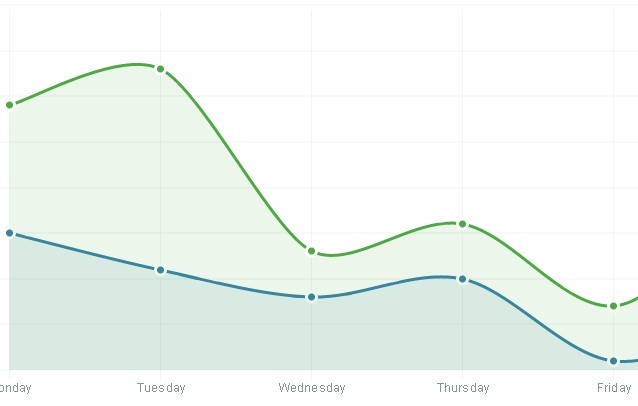
xCharts is a JavaScript library using D3.js for building beautiful and custom data-driven chart visualizations for the web. Using HTML, CSS, and SVG, xCharts are designed to be dynamic, fluid, and open to integrations and customization.
Basic Usage:
1. Include Necessary Javascripts and CSS:
<script src="d3.v2.min.js"></script><script src="xcharts.min.js"></script> <link rel="stylesheet" href="xcharts.min.css">
2. Configure your data using xChart's Data Format.
3. HTML.
<figure style="width: 400px; height: 300px;" id="myChart"></figure>
4. Create Your Chart.
var myChart = new xChart('bar', data, '#myChart');
This awesome jQuery plugin is developed by unknown. For more Advanced Usages, please check the demo page or visit the official website.