Sparkline (Inline Chart) Plugin With jQuery And SVG - inlineGraph
| File Size: | 27.7 KB |
|---|---|
| Views Total: | 4125 |
| Last Update: | |
| Publish Date: | |
| Official Website: | Go to website |
| License: | MIT |
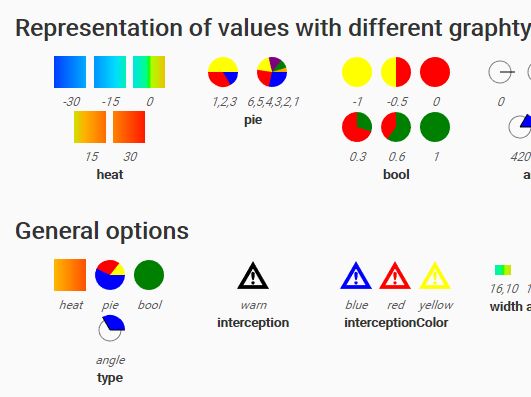
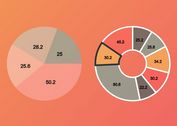
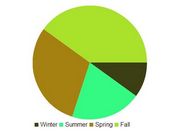
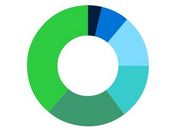
inlineGraph is a lightweight and simple-to-use jQuery plugin used for generating SVG based inline graphs and charts (aka. sparklines) to present your data as heatmap, pie, boolean and angle.
Basic usage:
1. To get started, insert the JavaScript file inlinegraph.js after jQuery JavaScript library.
<script src="/path/to/cdn/jquery.min.js"></script>
<script src="inlinegraph.js"></script>
2. Create an element where you want to place the inline graph.
<div class="inlinegraph"></div>
3. The JavaScript to generate an inline graph inside the element.
- values: numeric value.
- attr: plugin settings.
$(function(){
  $('.inlinegraph').inlinegraph(values, attr)
});
4. All default attributes (settings).
$('.inlinegraph').inlinegraph(30, {

  // or 'heat', 'bool', 'angle'
  type: 'pie',

  // interception text
  interception: 'warn',

  // interception color
  interceptionColor: 'black',

  // height in pixels
  height: 16,

  // width in pixels
  width: 16,

  // pre-defined colors
  color: ['blue','red','yellow','purple','green','orange'],

  // border color
  borderColor: 'black',

  // border width in pixels
  borderWidth: 0,

  // rotation angle
  rotation: 0

})
5. You can also pass the attributes (settings) via data attributes as follows:
<div class="inlinegraph"
     data-graph="60"
     data-graph-attr='{"color": ["green"], "type": "angle"}'>
</div>
<div class="inlinegraph"
     data-graph="14"
     data-graph-attr='{"color": ["green"], "fullAngle": "24", "type": "angle"}'>
</div>
...
$('.inlinegraph').each(function() {
  $(this).inlinegraph($(this).attr('data-graph'), $.parseJSON($(this).attr('data-graph-attr')));
});
Changelog:
2024-10-03
- JS & CSS Update
This awesome jQuery plugin is developed by tmunz. For more Advanced Usages, please check the demo page or visit the official website.

