Touch-enable Draggable Pie Chart Generator In JavaScript/jQuery
| File Size: | 15.7 KB |
|---|---|
| Views Total: | 1484 |
| Last Update: | |
| Publish Date: | |
| Official Website: | Go to website |
| License: | MIT |
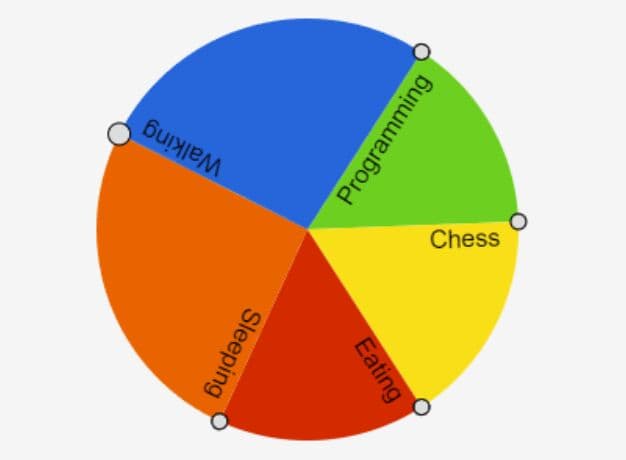
Draggable Piechart is a JavaScript/jQuery plugin that helps developers generate a draggable, interactive, mobile-friendly pie chart using HTML5 canvas.
It allows users to change the proportions of each segment by simply using mouse drag and touch gestures, which provide a unique and interactive experience for data visualization.
How to use it:
1. To start using the Draggable Piechart, load the following JavaScript file into your document.
<!-- Vanilla JS -->
<script src="/path/to/draggable-piechart.js"></script>

<!-- jQuery -->
<script src="/path/to/cdn/jquery.min.js"></script>
<script src="/path/to/cdn/draggable-piechart-jquery.js"></script>
2. Create an empty canvas element to hold the pie chart.
<canvas id="piechart" width="300" height="300">
  Your browser is too old!
</canvas>
3. Initialize a new DraggablePiechart instance and then provide your data in the form of an array of objects as displayed below:
var data = [
    {
      proportion: 30,
      format: {
        color: "#000000",
        label: 'JavaScript'
      },
      collapsed: true, // collapse the proportion when dragged to zero
    },
    {
      proportion: 40,
      format: {
        color: "#333333",
        label: 'HTML'
      },
      collapsed: false,
    },
    {
      proportion: 30,
      format: {
        color: "#666666",
        label: 'CSS'
      },
    },
]
var myPieChart = new DraggablePiechart({
    canvas: document.getElementById('piechart'),
    data: data,
});
4. Available options to customize the pie chart.
var myPieChart = new DraggablePiechart({
    radius: 0.9,
    collapsing: false,
    minAngle: 0.1,
    drawSegment: function (context, piechart, centerX, centerY, radius, startingAngle, arcSize, format, collapsed) {
      if (collapsed) {
        return;
      }
      // Draw coloured segment
      context.save();
      var endingAngle = startingAngle + arcSize;
      context.beginPath();
      context.moveTo(centerX, centerY);
      context.arc(centerX, centerY, radius, startingAngle, endingAngle, false);
      context.closePath();
      context.fillStyle = format.color;
      context.fill();
      context.restore();
      // Draw label on top
      context.save();
      context.translate(centerX, centerY);
      context.rotate(startingAngle);
      var fontSize = Math.floor(context.canvas.height / 25);
      var dx = radius - fontSize;
      var dy = centerY / 10;
      context.textAlign = "right";
      context.font = fontSize + "pt Helvetica";
      context.fillText(format.label, dx, dy);
      context.restore();
    },
    drawNode: function (context, piechart, x, y, centerX, centerY, hover) {
      context.save();
      context.translate(centerX, centerY);
      context.fillStyle = '#DDDDDD';
      var rad = hover ? 7 : 5;
      context.beginPath();
      context.arc(x, y, rad, 0, TAU, true);
      context.fill();
      context.stroke();
      context.restore();
    }
});
5. Call a function every time the pie chart changes.
var myPieChart = new DraggablePiechart({
    onchange: function onPieChartChange(piechart) {
      // get the percentage for the first slice
      var firstPercentage = piechart.getSliceSizePercentage(0);
      // get all percentages
      var percentages = piechart.getAllSliceSizePercentages();
    }
});
This awesome jQuery plugin is developed by jamesalvarez. For more Advanced Usages, please check the demo page or visit the official website.