Basic SVG Chart Plugin For jQuery - jChart
| File Size: | 38.9 KB |
|---|---|
| Views Total: | 10983 |
| Last Update: | |
| Publish Date: | |
| Official Website: | Go to website |
| License: | MIT |
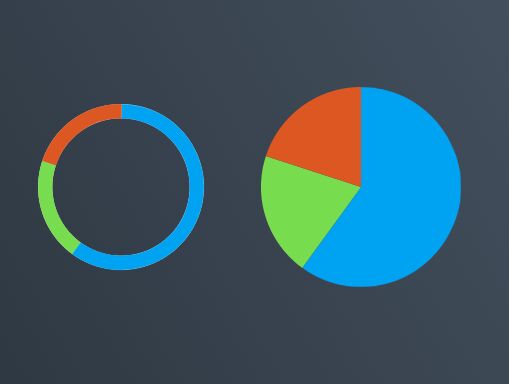
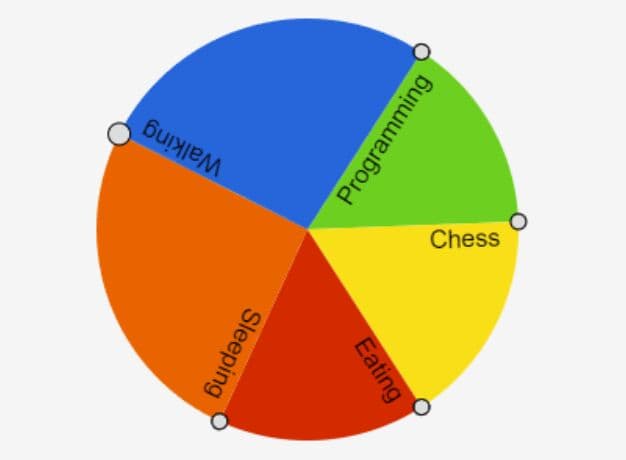
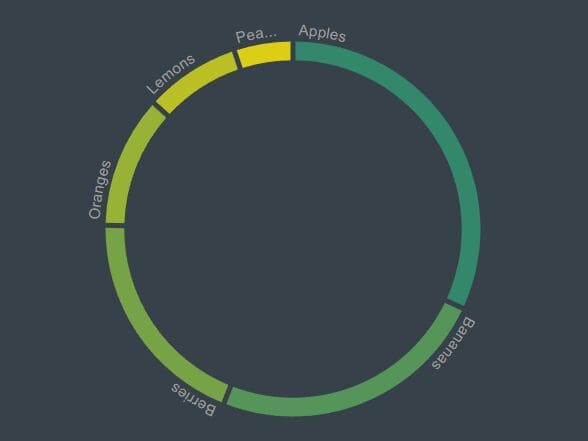
jChart is an easy-to-use jQuery plugin for rendering SVG based, vector shaped pie & donut charts that display each value as a part of a pie or donut.
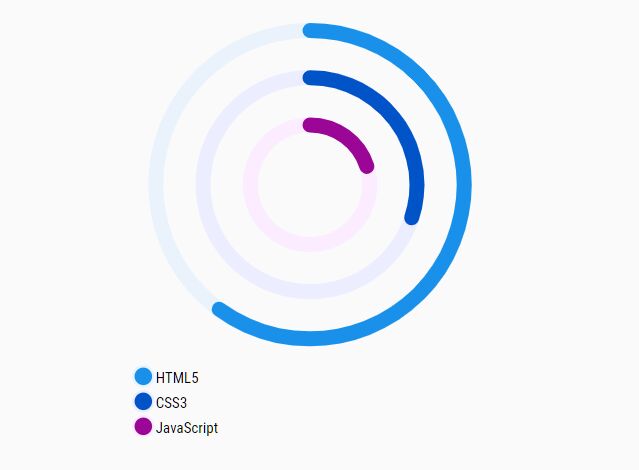
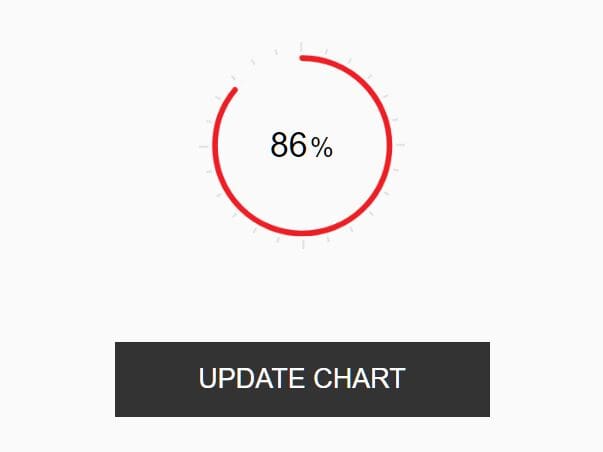
New: Currently supports gauge and bar charts.
How to use it:
1. Import the latest version of jQuery library and the jChart plugin's script into the document.
<script src="https://code.jquery.com/jquery-3.3.1.slim.min.js"
        integrity="sha384-q8i/X+965DzO0rT7abK41JStQIAqVgRVzpbzo5smXKp4YfRvH+8abtTE1Pi6jizo"
        crossorigin="anonymous">
</script>
<script src="/src/js/jchart.js"></script>
2. Create a container element to hold the chart.
<div id="element"></div>
3. Prepare your data in an array of objects as these:
const mydata = [
      {
        value: 300
      },
      {
        value: 100,
        color: '#77dd4f', // stroke color of the segment
        draw: true, // draw the segment on the chart or not
        push: true //push the next segment via offset
      },
      {
        value: 100,
        color: '#dd5723'
      }
]
4. Initialzie the plugin and render a default donut chart inside the container you just created.
const myChart = $("#element").jChart({
  data: myData
});
5. Render the data as a pie chart instead.
const myChart = $("#element").jChart({
  data: myData,
  appearance: {
    type: 'donut'
  }
});
6. The necessary CSS to style the pie & donut chart.
.jchart--donut--segment, .jchartpie--segment {
  transition: stroke-dasharray 1s ease;
}

.jchart {
  width: 400px;
  height: 400px;
}

.jchart--body {
  width: 100%;
  height: 100%;
}
7. All default configuration options.
const myChart = $("#element").jChart({

  // selectors
  elements: {
    container: null,
    body: null,
    group: null,
    figure: null,
    svg: null,
    segments: [],
    markers: null
  },

  // your own data
  data: [],

  // values necessary for the graphing, like sum of values of all segments
  values: {},

  placeholder: {
    data: {
      value: 0, // value of the segment
      color: {
        normal: '#00a3f2', // stroke/fill color of the segment
        active: '#00d8f2',
      },
      draw: true, // whether to draw the segment on the chart or not; default true
      push: true, // whether to push the next segment via offset. Best to set false together when draw is set to false (the empty section will always be at the end that way); default true
      order: null, // drawing order
      title: 'untitled',
      strokeWidth: 3
    }
  },

  // appearance options
  appearance: {
    type: 'donut', // or 'pie', 'bar'
    baseColor: '#ddd',
    segmentColor: {
        normal: '#00a3f2',
        active: '#00d8f2',
    },
    baseOffset: 0, // offset for starting point of first segment
    baseStrokeWidth: 1,
    strokeWidth: 3, // default stroke width for all segments
    animated: true,

    title: {
      chartTitle: '',
      showValue: true, // tooltips
      showPercentage: true,
      showSummary: false, // summary - show a value inside the donut chart
      summaryTitle: '', // by default it shows the percentage of the greatest segment in the chart
      // (if summaryTitle is empty)
      summarySegment: null // the segment's id which percentage will be displayed in the summary
    },

    /* DONUT AND CIRCLE */
    radius: 100 / (2 * Math.PI),
    innerCutout: 0.75, // how "thin" the segments are from the center point. (0 will render a pie chart (full circle))
    centerX: 21,
    centerY: 21,

    /* DONUT */
    subType: 'circle', // render type: circle for circle based approach, path for line and arc approach using path
    isGauge: false, // if the donut will be rendered as a full circle or a half-circle
    gap: 1, // gap between segments for donut chart (in percentage, 1 = 1%)

    /* BAR */
    showMarkers: true,
    markerColor: '#f45a42',
    markerCount: 10,
    markerWidth: 0.5, // in percentage of width - 0.5 means 0.5%
    rx: 0, // horizontal corner radius
    ry: 0 // vertical corner radius
  },

  // callback function
  callbacks: {
    onInit() {
    },
    onRefresh() {
    },
    onSegmentMouseover() {
    },
    onSegmentMouseout() {
    }
  }

});
Changelog:
2019-07-12
- JS update
2019-02-20
- bugfix
- added more configs
2018-11-16
- fix showSummary on donut chart when there are no drawable segments
2018-09-25
- horizontal bar markers offsetX fix (markers in the middle have their offsetX modified by half their width)
2018-08-28
- added markers to bar chart
2018-08-25
- added gaps to pie charts
2018-08-22
- Added bar chart type.
2018-08-22
- Added Gauge chart + fixed gap issues on donut charts
2018-08-21
- Bugfix
2018-08-17
- update - ignore empty segments when drawing gaps between them
2018-08-16
- update - fixed hover node bug, added comments to Refresh and Update functions
2018-08-14
- added more options and callbacks
2018-08-09
- Bugfix
2018-07-25
- JS & CSS updated
This awesome jQuery plugin is developed by Falkan3. For more Advanced Usages, please check the demo page or visit the official website.