Animated HTML5 Pie Chart Plugin With jQuery - Rotapie
| File Size: | 9.97 KB |
|---|---|
| Views Total: | 8198 |
| Last Update: | |
| Publish Date: | |
| Official Website: | Go to website |
| License: | MIT |
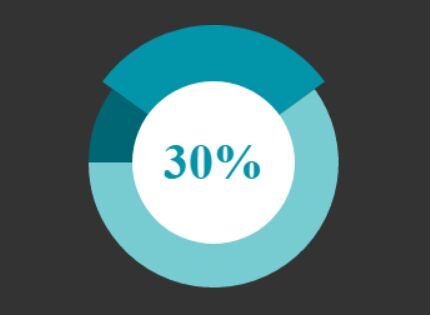
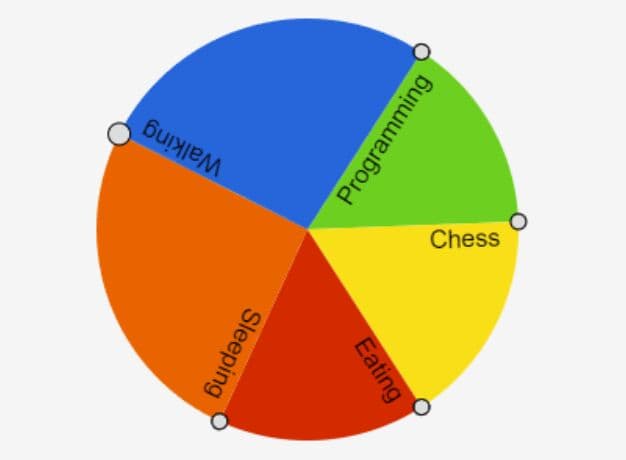
The Rotapie jQuery plugin makes use of HTML5 canvas API to draw a responsive, customizable, animated, interactive pie chart on your web applications. The selected slice will be rotated and displayed at the top of the chart when you click on it. The plugin comes with lots of useful options & api to customize the pie chart quickly.
How to use it:
1. Load the JavaScript jquery.rotapie.js after jQuery library and the Rotapie plugin is ready for use.
<script src="//code.jquery.com/jquery-3.2.0.min.js"></script>
<script src="jquery.rotapie.js"></script>
2. Create a container element to place the pie chart.
<div id="pie"></div>
3. The JavaScript to draw a basic pie chart inside the container you just created.
$('#pie').rotapie({
  slices: [
    { color: '#006673', percentage: 10 },
    { color: '#0294a8', percentage: 20 },
    { color: '#77ccd1', percentage: 70 }
  ],
});
4. All default customization options and callback functions.
$('#pie').rotapie({

  // custom slices
  slices: [
    { color: '#006673', percentage: 10 },
    { color: '#0294a8', percentage: 20 },
    { color: '#77ccd1', percentage: 70 }
  ],

  // Start index selected slice.
  sliceIndex: 0,

  // rotation angle in radians between frames
  deltaAngle: 0.2,

  // min/max radius of unselected slices
  // can be set to percentage of container width i.e. '50%'
  minRadius: 100,
  maxRadius: 110,

  // min/max radius of inner circle when animated
  minInnerRadius: 55,
  maxInnerRadius: 65,

  // background color of inner circle
  innerColor: '#fff',

  // min/max font size
  minFontSize: 30,
  maxFontSize: 40,

  // font offset
  fontYOffset: 0,

  // font family
  fontFamily: 'Times New Roman',

  // font weight
  fontWeight: 'bold',

  // custom decimal
  decimalPoint: '.',

  // is clickable?
  clickable: true

  // callback functions
  beforeAnimate: function (nextIndex, settings) {
    var canvas = this;
    return false;
  },

  afterAnimate: function(settings){
    var canvas = this;
    var index = settings.sliceIndex;
  }

});
5. API methods.
var myChart = $('#pie').rotapie();

// animate to the next slice index
myChart.animate(index, pieIndex)

// redraw the pie chart
myChart.repaint(pieIndex);

// retrieve the settings object
myChart.getSettings(pieIndex)
This awesome jQuery plugin is developed by ErikvdBerg. For more Advanced Usages, please check the demo page or visit the official website.