Simple Plain Bar Chart Plugin With jQuery - Graphite.js
| File Size: | 6.36 KB |
|---|---|
| Views Total: | 4848 |
| Last Update: | |
| Publish Date: | |
| Official Website: | Go to website |
| License: | MIT |
Graphite.js is a lightweight jQuery plugin to generate a minimal, clean, dynamic, configurable bar/column chart from a data object. With support for x-axis labels and y-axis markers.
How to use it:
1. Download and insert the JavaScript file graphite.js after the latest jQuery library.
<script src="https://code.jquery.com/jquery-3.3.1.slim.min.js"
        integrity="sha384-q8i/X+965DzO0rT7abK41JStQIAqVgRVzpbzo5smXKp4YfRvH+8abtTE1Pi6jizo"
        crossorigin="anonymous">
</script>
<script src="graphite.js"></script>
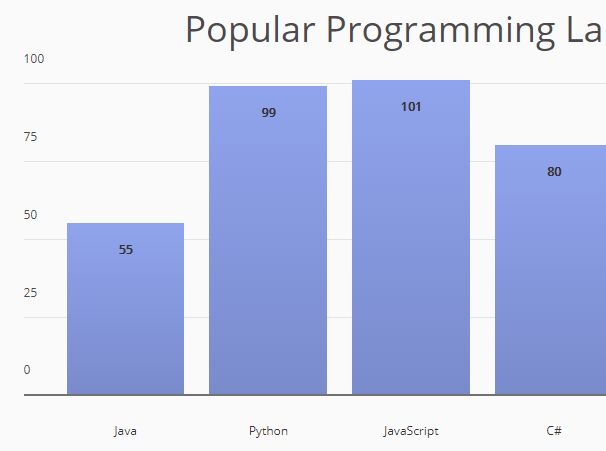
2. Prepare your data to visualize in the bar/column chart.
var myData = {
    'Java': 55,
    'Python': 99,
    'JavaScript': 101,
    'C#': 80,
    'Objective-C': 26,
    'PHP': 55
};
3. Create an element to holder the bar/column chart.
<div class="graph" id="example"></div>
4. Config the bar/column chart by overring the following settings.
var myOptions = {

    // default: 350
    'height': 400,

    // default: ''
    'title': 'Popular Programming Languages',

    // width of chart
    'width': 1000,

    // background color
    barColor: 'linear-gradient(rgb(144, 164, 237), rgb(122, 139, 204))'

    // default: 8
    'fixPadding': 18,

    // bar font
    'barFont': [0, 12, "bold"],

    // label font
    'labelFont': [0, 13, 0]

};
5. Plot your data to the bar/column chart.
graphite(myData, myOptions, example);
This awesome jQuery plugin is developed by jonathandannel. For more Advanced Usages, please check the demo page or visit the official website.


