Visualize Data Using Animated Circles - jQuery Circle.js
| File Size: | 4.9 KB |
|---|---|
| Views Total: | 1349 |
| Last Update: | |
| Publish Date: | |
| Official Website: | Go to website |
| License: | MIT |
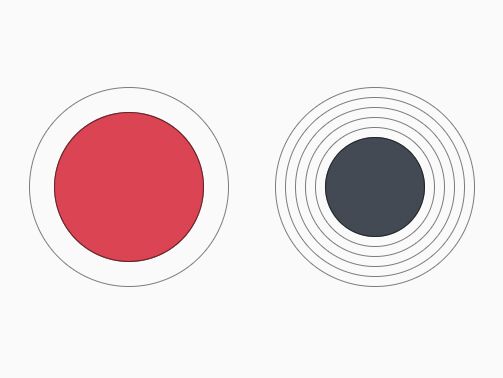
jQuery Circle.js is a lightweight data visualization plugin which can be used to reveals educational attainment levels using animated circles.
How to use it:
1. Add jQuery library and the Circle.js script ot the webpage.
<script src="https://code.jquery.com/jquery-3.3.1.slim.min.js"
        integrity="sha384-q8i/X+965DzO0rT7abK41JStQIAqVgRVzpbzo5smXKp4YfRvH+8abtTE1Pi6jizo"
        crossorigin="anonymous">
</script>
<script src="jquery.circle.js"></script>
2. Initialize the plugin and we're ready to go.
$(function(){

  $('.circle').circle();

});
3. Create a DIV container with the class of 'circle' and config the circles graph using the following options.
- color: fill color, default: 'red'
- graduation: the amount of circles, default: 4
- graduationHighlight: highlight circles, default: 2
- fill: how many circles to fill, default: 0
- animateDuration: duration of the fill animation, default: 1000
- animateDelay: delay of the fill animation, default: 0
<div class="circle" data-circleconfig='{"color": "red", "graduation": 4, "fill": 3}'>

</div>
4. Available event handlers.
$(function(){

  $('.circle').circle({

    // when the aniamtion is completely finished
    animationComplete: function(){},

    // on create
    create: function(){}

  });

});
This awesome jQuery plugin is developed by neuerituale. For more Advanced Usages, please check the demo page or visit the official website.


