Easy and Object Oriented Javscript Chart Library - Chart.js
| File Size: | 280 KB |
|---|---|
| Views Total: | 7954 |
| Last Update: | |
| Publish Date: | |
| Official Website: | Go to website |
| License: | MIT |
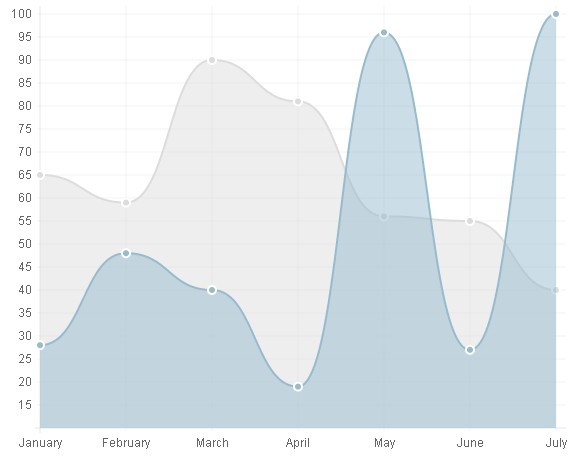
Chart.js is a flexible and easy-to-use javascript chart library which takes advantage of HTML5 canvas tag to quickly create animated and nice look charts for your projects. Currently it supports 6 chart types: line charts, bar charts, pie charts, radar charts, polar charts, and doughnut charts.
Basic Usage:
1. Include Chart.js on your page
<script src="Chart.js"></script>
2. The HTML
<canvas id="canvas" height="450" width="600"></canvas>
3. The javascript
<script>
var barChartData = {
labels : ["January","February","March","April","May","June","July"],
datasets : [
{
fillColor : "rgba(220,220,220,0.5)",
strokeColor : "rgba(220,220,220,1)",
data : [65,59,90,81,56,55,40]
},
{
fillColor : "rgba(151,187,205,0.5)",
strokeColor : "rgba(151,187,205,1)",
data : [28,48,40,19,96,27,100]
}
]
}
var myLine = new Chart(document.getElementById("canvas").getContext("2d")).Bar(barChartData);

</script>
This awesome jQuery plugin is developed by nnnick. For more Advanced Usages, please check the demo page or visit the official website.