HTML5 & JavaScript Column Charts - CanvasJS
| File Size: | 71.6KB |
|---|---|
| Views Total: | 16903 |
| Last Update: | |
| Publish Date: | |
| Official Website: | Go to website |
| License: | MIT |
CanvasJS is an HTML5 & JavaScript based Charting Library that runs on all modern devices including iPhone, Android, Desktops, etc. Charts are beautiful and API is very simple to use.
Features:
- Simple and easy to use
- Runs on all modern devices
- High performance
- Comes with Several beautiful looking themes
- Supports 14 different types of Charts / Graphs
Basic Usage:
1. Include JS CanvasJS library on the page
<script type="text/javascript" src="canvasjs.min.js"></script>
2. The Html
<div id="chartContainer" style="height: 300px; width: 100%;"> </div>
3. The javascript
<script type="text/javascript">
window.onload = function () {
var chart = new CanvasJS.Chart("chartContainer",
{
title:{
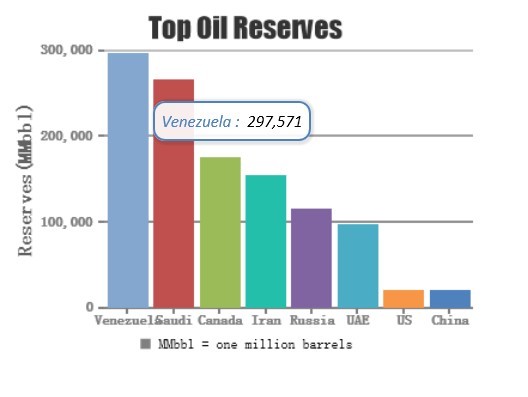
text: "Top Oil Reserves",
},
axisY: {
title: "Reserves(MMbbl)"
},
legend: {
verticalAlign: "bottom",
horizontalAlign: "center"
},
theme: "theme2",
data: [
{
type: "column",
showInLegend: true,
legendMarkerColor: "grey",
legendText: "MMbbl = one million barrels",
dataPoints: [
{y: 297571, label: "Venezuela"},
{y: 267017, label: "Saudi" },
{y: 175200, label: "Canada"},
{y: 154580, label: "Iran"},
{y: 116000, label: "Russia"},
{y: 97800, label: "UAE"},
{y: 20682, label: "US"},
{y: 20350, label: "China"},
]
},
]
});
chart.render();
}
</script>
About Author:
Author: fenopix
Home Page: http://canvasjs.com
This awesome jQuery plugin is developed by fenopix. For more Advanced Usages, please check the demo page or visit the official website.


