Create A Stacked Donut Chart With radialBar Plugin
| File Size: | 5.23 KB |
|---|---|
| Views Total: | 4291 |
| Last Update: | |
| Publish Date: | |
| Official Website: | Go to website |
| License: | MIT |
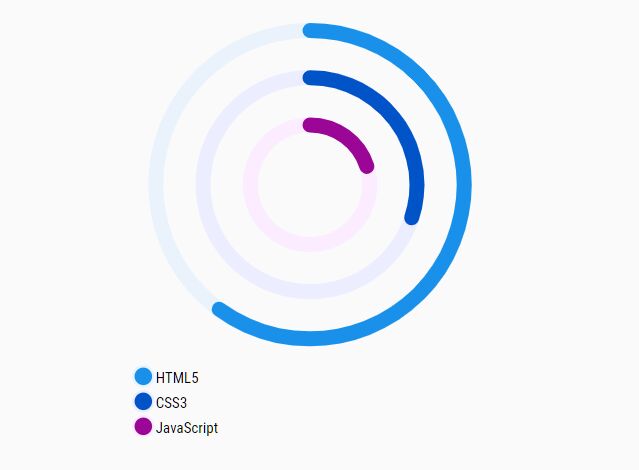
radialBar is a tiny jQuery plugin for rendering multiple SVG-based concentric circles to visualize your percentage data as a stacked donut chart.
How to use it:
1. Create a placeholder element for the stacked donut chart.
<div class="radial"></div>
2. Load the minified version of the radialBar plugin after jQuery.
<script src="/path/to/cdn/jquery.min.js"></script>
<script src="/path/to/jquery.radialBar.min.js"></script>
3. Prepare your data with the following properties:
var data = [
    {
      primaryColor: "#1991EB",
      secondaryColor: "#EAF3FB",
      progress: "80",
      labelText: "HTML5"
    },
    {
      primaryColor: "#0154C8",
      secondaryColor: "#ECEDFF",
      progress: "60",
      labelText: "CSS3"
    },
    {
      primaryColor: "#9B0696",
      secondaryColor: "#FBECFF",
      progress: "40",
      labelText: "JavaScript"
    }
];
4. Render a stacked donut chart on the page.
$(".radial").radialBar({
  data: data
});
5. Set the height/width of the donut chart.
$(".radial").radialBar({
  data: data,
  width: "300",
  height: "300"
});
6. Set the stroke width in pixels.
$(".radial").radialBar({
  data: data,
  strokeWidth: 12
});
This awesome jQuery plugin is developed by AhedKabalan. For more Advanced Usages, please check the demo page or visit the official website.