Fully Featured Gantt Chart Component By IBM
| File Size: | 3.28 MB |
|---|---|
| Views Total: | 18473 |
| Last Update: | |
| Publish Date: | |
| Official Website: | Go to website |
| License: | MIT |
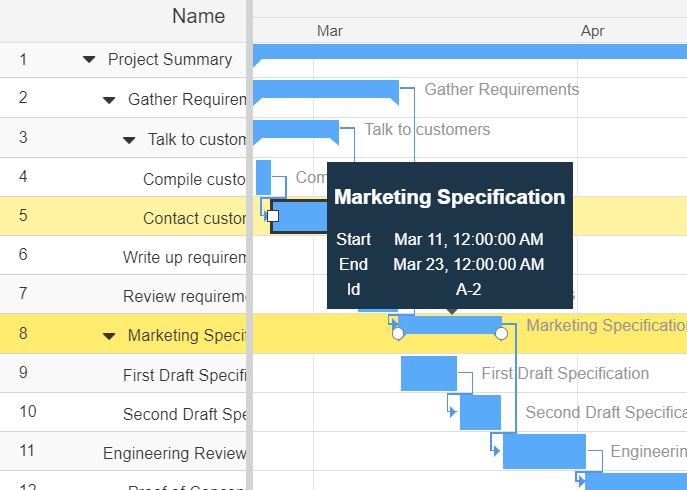
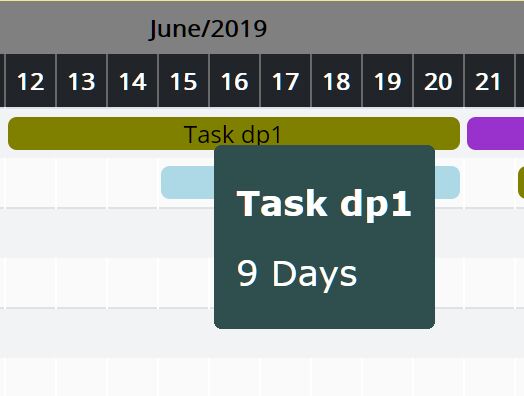
Gantt Chart is a type of bar chart that can be used to visualize your data (activities and scheduled tasks) in a 2D timeline interface.
IBM Gantt Chart is a JavaScript library that provides an easy way to implement a customizable, professional, full featured online gantt chart generator for scheduling your tasks on your modern web app.
Features:
- Works with jQuery, Vanilla JavaScript, and React.js framework.
- Collapsible task names.
- Fully responsive and auto fits your layout.
- Custom date format.
- Custom time table rendering and layout.
- Allows the user to zoom in/out the Gantt Chart.
- Allows the user to filter and search through data.
- Supports AJAX data fetching.
- Supports any types of data: "json", "xml", "html" or "text".
Basic usage:
1. Load the stylesheet ibm-gantt-chart.css and JavaScript ibm-gantt-chart.js from the dist folder.
<link href="./dist/ibm-gantt-chart.css" rel="stylesheet" />
<script src="./dist/ibm-gantt-chart.js"></script>
2. Create a placeholder for the gantt chart.
<div id="gantt"></div>
3. Prepare your data in a JS array containing ID, names, and activities as follows.
var data = [
    {
      id: 'NURSES+Anne',
      name: 'Anne',
      activities: [
        {
          id: 'SHIFTS+Emergency+Monday+2+8',
          name: 'Emergency',
          start: 1474880400000,
          end: 1474902000000,
        },
      ],
    },
    {
      id: 'NURSES+Bethanie',
      name: 'Bethanie',
      activities: [],
    },
    {
      id: 'NURSES+Betsy',
      name: 'Betsy',
      activities: [
        {
          id: 'SHIFTS+Emergency+Wednesday+12+18',
          name: 'Emergency',
          start: 1475089200000,
          end: 1475110800000,
        },
        {
          id: 'SHIFTS+Emergency+Saturday+12+20',
          name: 'Emergency',
          start: 1475348400000,
          end: 1475377200000,
        },
        {
          id: 'SHIFTS+Consultation+Friday+8+12',
          name: 'Consultation',
          start: 1475247600000,
          end: 1475262000000,
        },
      ],
    },
    {
      id: 'NURSES+Cathy',
      name: 'Cathy',
      activities: [
        {
          id: 'SHIFTS+Emergency+Sunday+20+2',
          name: 'Emergency',
          start: 1475463600000,
          end: 1475485200000,
        },
        {
          id: 'SHIFTS+Emergency+Saturday+12+20',
          name: 'Emergency',
          start: 1475348400000,
          end: 1475377200000,
        },
        {
          id: 'SHIFTS+Emergency+Monday+18+2',
          name: 'Emergency',
          start: 1474938000000,
          end: 1474966800000,
        },
      ],
    },
    {
      id: 'NURSES+Cindy',
      name: 'Cindy',
      activities: [
        {
          id: 'SHIFTS+Emergency+Saturday+20+2',
          name: 'Emergency',
          start: 1475377200000,
          end: 1475398800000,
        },
        {
          id: 'SHIFTS+Consultation+Friday+8+12',
          name: 'Consultation',
          start: 1475247600000,
          end: 1475262000000,
        },
        {
          id: 'SHIFTS+Consultation+Tuesday+8+12',
          name: 'Consultation',
          start: 1474988400000,
          end: 1475002800000,
        },
      ],
    },
];
4. Config how to fetch resources for the Gantt chart.
var config = {
    data: {
      resources: {
        data: data, // resources are provided in an array. Instead, we could configure a request to the server.
        // Activities of the resources are provided along with the 'activities' property of resource objects.
        // Alternatively, they could be listed from the 'data.activities' configuration.
        activities: 'activities',
        name: 'name', // The name of the resource is provided with the name property of the resource object.
        id: 'id', // The id of the resource is provided with the id property of the resource object.
      },
      // As activities are provided along with the resources, this section only describes how to create
      // activity Gantt properties from the activity model objects.
      activities: {
        start: 'start', // The start of the activity is provided with the start property of the model object
        end: 'end', // The end of the activity is provided with the end property of the model object
        name: 'name', // The name of the activity is provided with the name property of the model object
      },
    },
};
5. Configure a toolbar associated with the Gantt chart.
var config = {
    toolbar: [
      'title',
      'search',
      'separator',
      {
        type: 'button',
        text: 'Refresh',
        fontIcon: 'fa fa-refresh fa-lg',
        onclick: function(ctx) {
          ctx.gantt.draw();
        },
      },
      'fitToContent',
      'zoomIn',
      'zoomOut',
    ],
};
6. Initialize the library to generate a basic Gantt chart.
new Gantt('gantt', config);
7. Implement the IBM Gantt Chart as a jQuery plugin.
<!-- jQuery Library -->
<script src="jquery.min.js"></script>
<!-- jQuery Datatables plugin -->
<script src="jquery.dataTables.min.js"></script>
<link href="jquery.dataTables.min.css" rel="stylesheet" />
<!-- VIS Library -->
<script src="vis.min.js"></script>
<link href="vis.min.css" rel="stylesheet" type="text/css" />
<!-- IBM Gantt Chart -->
<link href="./dist/ibm-gantt-chart-jquery.css" rel="stylesheet" />
<script src="./dist/ibm-gantt-chart-jquery.js"></script>
new Gantt('gantt', config);
8. Implement the IBM Gantt Chart as a React component.
import React from 'react';
import ReactDOM from 'react-dom';
import GanttChart from 'ibm-gantt-chart-react';
import 'ibm-gantt-chart/dist/ibm-gantt-chart.css';
const config = { ... };
ReactDOM.render(<GanttChart config={config} />, document.getElementById('gantt'));
9. Implement the IBM Gantt Chart as a React component.
import React from 'react';
import ReactDOM from 'react-dom';
import GanttChart from 'ibm-gantt-chart-react';
import 'ibm-gantt-chart/dist/ibm-gantt-chart.css';
const config = { ... };
ReactDOM.render(<GanttChart config={config} />, document.getElementById('gantt'));
10. For advanced usages, visit the Official Documentation for more details.
Changelog:
2024-10-18
- v0.5.33
This awesome jQuery plugin is developed by IBM. For more Advanced Usages, please check the demo page or visit the official website.