Stacked Horizontal Gantt Chart Plugin With jQuery
| File Size: | 158 KB |
|---|---|
| Views Total: | 11553 |
| Last Update: | |
| Publish Date: | |
| Official Website: | Go to website |
| License: | MIT |
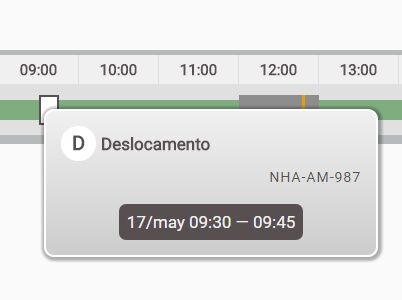
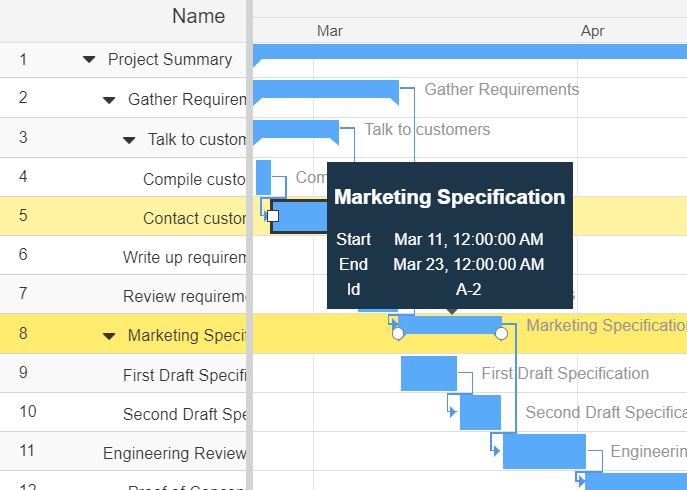
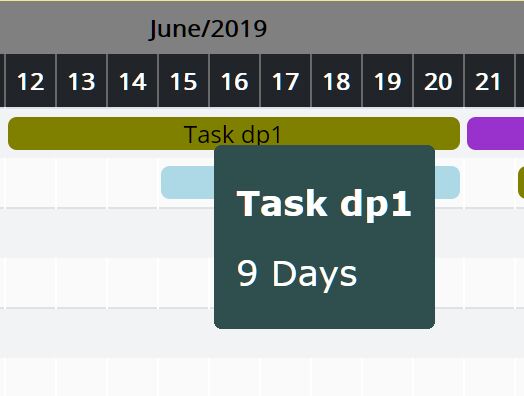
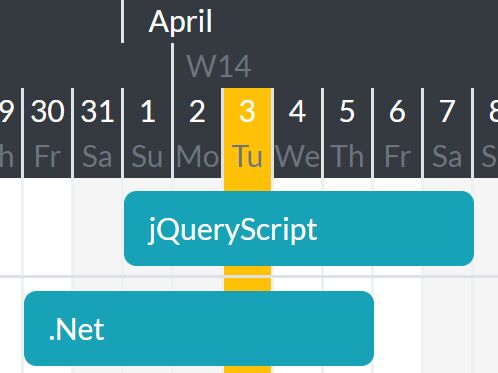
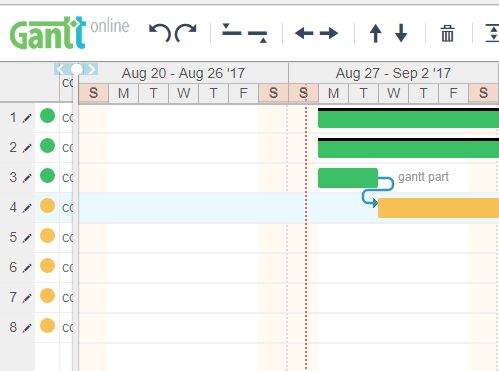
A simple, configurable jQuery plugin for creating a timeline-style gantt chart to illustrates a project schedule with custom markers and stacked activities.
Basic usage:
1. To use the Stacked Gantt plugin, load the following JavaScript and CSS files in the document:
<link rel="stylesheet" href="jquery.stacked-gantt.css">
<script src="//code.jquery.com/jquery.min.js"></script>
<script src="jquery.stacked-gantt.min.js"></script>
2. Create a placeholder element for your gantt chart:
<div id="timeline"></div>
3. Define your data containing start/end dates, markers and activities/tasks in the JavaScript:
var data = [
{
  description: 'NHA-AM-420',
  thresholds: [
    { begin: createDate('09:00'), end: createDate('13:00') },
    { begin: createDate('22:00'), end: createDate('05:00', 1) }
  ],
  markers: [ { description: 'Marker 1', when: createDate('15:30'), onClick: null }],
  activities: [
    { code: 'DESLC', description: 'Deslocamento', begin: createDate('22:00'), end: createDate('22:45') },
    { code: 'ATIV', description: 'Atividade de nome maior para testar quebra de linha', begin: createDate('22:45'), end: createDate('23:30') },
    { code: 'DESLC', description: 'Deslocamento', begin: createDate('23:30'), end: createDate('23:45') },
    { code: 'ATIV', description: 'Atividade', begin: createDate('23:45'), end: createDate('02:00', 1) },
    { code: 'REFEI', description: 'Refeição', begin: createDate('02:00', 1), end: createDate('03:00', 1) },
    { code: 'ATIV', description: 'Atividade', begin: createDate('03:00', 1), end: createDate('04:30', 1) },
    { code: 'ATIV', description: 'Atividade', begin: createDate('04:30', 1), end: createDate('06:00', 1), color: "#e592d7", height: "25px" },
  ]
},
{
  description: 'NHA-AM-422',
  thresholds: [{ begin: createDate('10:00'), end: createDate('19:53') }],
  markers: [ { description: 'Marker 2', when: createDate('16:53') }],
  activities: [
    { code: 'DESLC', description: 'Deslocamento', begin: createDate('9:00'), end: createDate('9:15') },
    { code: 'ATIV', description: 'Atividade', begin: createDate('9:15'), end: createDate('9:30') },
    { code: 'DESLC', description: 'Deslocamento', begin: createDate('9:30'), end: createDate('9:45') },
    { code: 'ATIV', description: 'Atividade', begin: createDate('9:45'), end: createDate('12:00') },
    { code: 'REFEI', description: 'Refeição', begin: createDate('12:00'), end: createDate('13:00') },
    { code: 'ATIV', description: 'Atividade', begin: createDate('13:00'), end: createDate('18:00') },
  ]
},
{
  description: 'NHA-AM-432',
  thresholds: [{ begin: createDate('7:08'), end: createDate('16:50') }],
  markers: [
    { description: 'Marker 3', when: createDate('17:38') },
    { description: 'Marker 4', when: createDate('19:14'),
    onClick: function(marker) {
      alert('Marker custom on click: '+marker.description);
    } }
  ],
  activities: [
    { code: 'DESLC', description: 'Deslocamento', begin: createDate('9:00'), end: createDate('9:15'), onClick: null },
    { code: 'ATIV', description: 'Atividade', begin: createDate('9:15'), end: createDate('9:30'),
    onClick: function(activity, row) {
      alert('Activity custom on click: '+activity.description + ' of row ' + row.description);
    }
  },
  { code: 'DESLC', description: 'Deslocamento', begin: createDate('9:30'), end: createDate('9:45') },
  { code: 'ATIV', description: 'Atividade', begin: createDate('9:45'), end: createDate('12:00') },
  { code: 'REFEI', description: 'Refeição', begin: createDate('12:00'), end: createDate('13:00') },
  { code: 'ATIV', description: 'Atividade', begin: createDate('13:00'), end: createDate('18:30') },
  ]
},
];
4. The JavaScript to visualize your data in a gantt chart:
$('#timeline').stackedGantt({
  data: data
});
5. API methods:
// Increases by 10% the hour's width in the chart.
$('#timeline').stackedGantt('zoomIn');

// Decreases by 10% the hour's width in the chart.
$('#timeline').stackedGantt('zoomOut');

// Removes all graphical elements from the screen and also destroys the stackedGantt instance.
$('#timeline').stackedGantt('destroy');

// Updates the chart's data and generalMarkers without changing the custom style and events properties that were defined at instantiation time.
// data: Contains the data for each row of the chart.
// generalMarkers: Contains data for the markers that crosses all rows in the chart.
$('#timeline').stackedGantt('update', data, generalMarkers);

// Returns the data array used to build the chart.
$('#timeline').stackedGantt('getData');

// Returns the generalMarkers array used to build the General Markers.
$('#timeline').stackedGantt('getGeneralMarker');

// Returns the generalHighlights array used to build the General Highlights.
$('#timeline').stackedGantt('getGeneralHighlights');
Changelog:
2018-10-01
- vertical scrollbar added
2018-05-17
- Fix in tooltip creation that was wrong when used in created external window
2018-05-15
- Bug fix with the defaultDate when there was any empty activity array for a row
2018-05-11
- Adjusting the calculation of the distance between two dates in pixels to consider different timezones
2018-05-09
- Adding the getGeneralMarkers and getGeneralHighlights functions
2017-10-25
- Bug fix: crash when no activities, markers or thresholds are informed
2017-08-09
- Creating a simple example page
2017-08-01
- Creating the zoomIn, zoomOut and destroy functions.
This awesome jQuery plugin is developed by demarchisd. For more Advanced Usages, please check the demo page or visit the official website.