Create Horizontal Stacked Bar Charts In jQuery - horbar
| File Size: | 10.7 KB |
|---|---|
| Views Total: | 6046 |
| Last Update: | |
| Publish Date: | |
| Official Website: | Go to website |
| License: | MIT |
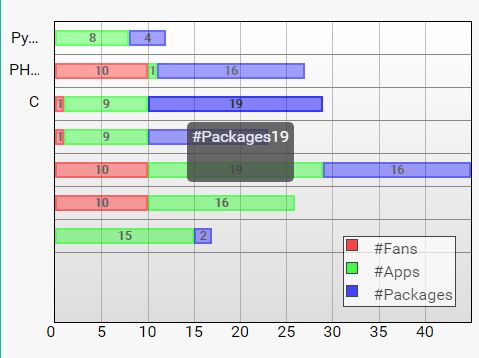
horbar is a lightweight jQuery plugin used to visualize your dynamic JavaScript data in a responsive, animated, horizontal, Stacked Bar Chart using pure JavaScript and CSS.
How to use it:
1. Link to the necessary JavaScript and CSS files as follows:
<link href="horbar.css" rel="stylesheet">
<script src="//code.jquery.com/jquery-3.2.1.min.js"></script>
<script src="horbar.js"></script>
2. Create an empty container for your bar chart.
<div id="my-chart"></div>
3. Initialize the plugin and define your own dataset presenting in the bar chart.
$('#my-chart').horbar({
  namespace: 'horbar',
  labels: ["Python", "PHP", "C"],
  data: {
    segments: [{
            'name': '#Fans',
            'color': '#FF0000'
        },
        {
            'name': '#Apps',
            'color': '#00FF00'
        },
        {
            'name': '#Packages',
            'color': '#0000FF'
        }
    ],
    dataSets: [
        // Some random sample data
        [r(), r(), r()],
        [r(), r(), r()],
        [r(), r(), r()],
        [r(), r(), r()],
        [r(), r(), r()],
        [r(), r(), r()],
        [r(), r(), r()]
    ]
  }
});
4. Config the bar chart in the 'OPTION' object during init.
$('#my-chart').horbar({
  bars: {
    animate: true,
    animationSpeed: 'slow',
    height: '50px'
  },
  legend: {
    position: "se",
    fontSize: '1em'
  },
  segment: {
    drawCallBack: function(segment, config) {
        defaultSegmentCallBack(segment, config);
    }
  },
  segmentEvents: {
    mouseenter: function(segment) {
        showPopover(segment);
    },
    mouseleave: function(segment) {
        removePopover(segment);
    }
  },
  segmentStyle: {
    borderAlpha: 0.9,
    backgroundAlpha: 0.6
  },
  yLabels: {
    drawCallBack: function(v) {
        return v;
    },
    events: {}
  },
  xLabels: {
    drawCallBack: function(v) {
        return v;
    },
    events: {}
  },
  xAxis: {
    width: '80%'
  },
  yAxis: {
    width: '20%'
  },
  tickLength: 10
});
Change log:
2017-05-08
- Set font-size as plain parameter for legends
This awesome jQuery plugin is developed by sonirico. For more Advanced Usages, please check the demo page or visit the official website.


