Modular Extensible Plotting Library For jQuery - jqPlot
| File Size: | 1.66 MB |
|---|---|
| Views Total: | 2848 |
| Last Update: | |
| Publish Date: | |
| Official Website: | Go to website |
| License: | MIT |
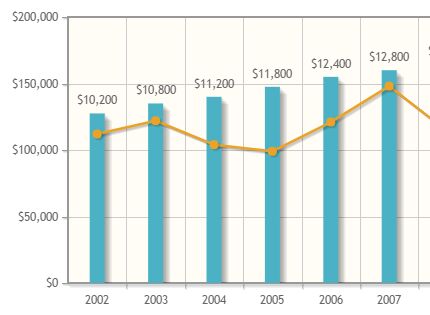
jqPlot is a modular, extensible, feature-rich jQuery plotting plugin for creating a variety of highly customizable, AJAX enabled, HTML5 canvas based charts & graphs to visualize your data.
Install it via NPM:
$ npm install jqplot
Basic usage:
1. To use the jqPlot plugin, simply include a reference to the following resources:
<link rel="stylesheet" href="/path/to/jquery.jqplot.css">
<script src="/path/to/jquery.min.js"></script>
<script src="/path/to/jquery.jqplot.min.js"></script>
2. Optionally, you can include the excanvas.js library to enable canvas support in old browsers.
<!--[if lt IE 9]>
<script src="/path/to/excanvas.js"></script>
<![endif]-->
3. Create a container to place your generated chart.
<div id="chartContainer"></div>
4. Define an array of data to be plotted in the chart.
dataArray = [34,12,43,55,77];
5. Visualize the data as a basic chart in the container you just created.
myChart = $.jqplot('chartContainer', [dataArray, ...], OPTION);
6. See optionsTutorial.txt in the zip for a list of options available through the options object
Changelog:
2018-09-27
- Fix zero or negative auto barWidth and allow minimum value
2018-04-18
- Avoid tool-tip off screen
2018-02-03
- Fix high-dpi canvasBackingScale issue
This awesome jQuery plugin is developed by jqPlot. For more Advanced Usages, please check the demo page or visit the official website.


