Attractive Plotting Plugin with jQuery - Flot
| File Size: | 1.06 MB |
|---|---|
| Views Total: | 9561 |
| Last Update: | |
| Publish Date: | |
| Official Website: | Go to website |
| License: | MIT |
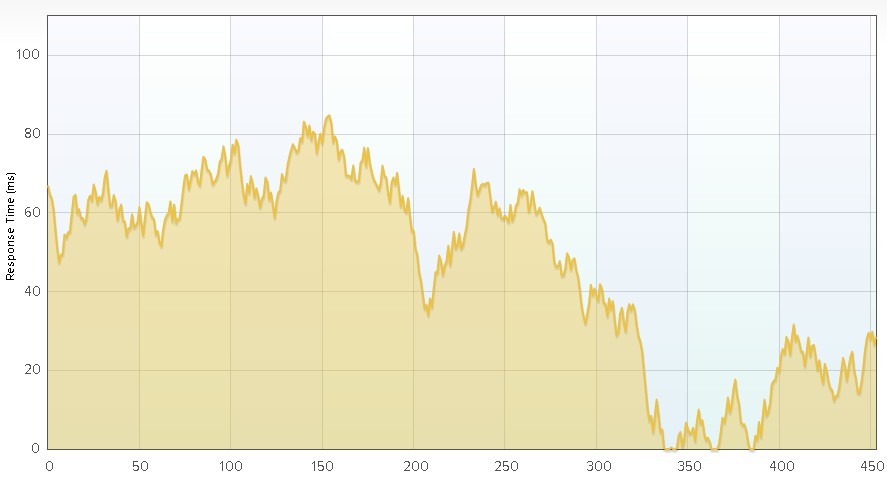
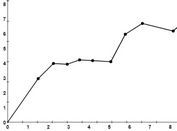
Flot is a JavaScript plotting library works with jQuery for generating dynamic, attractive and interactive Charts and Graphs using HTML5 canvas element.
You might also like jQuery Flot Animator plugin to animate your flot charts.
Install & download:
# NPM
$ npm install flot --save
Basic Usage:
1. Include jQuery and the Flot.js JavaScript libraries on the page.
<script src="/path/to/jquery.js"></script>
<script src="/path/to/jquery.flot.js"></script>
<!--[if lte IE 8]>
<script src="/path/to/excanvas.min.js"></script>
<![endif]-->
2. Create a placeholder element for the chart.
<div id="placeholder"></div>
3. Prepare your data to be plotted in the chart.
var data = [ ["January", 10], ["February", 8], ["March", 4], ["April", 13], ["May", 17], ["June", 9]];
4. Generate a basic line chart from the data array.
$.plot("#placeholder", data);
5. All default options to customize the chart.
$.plot("#placeholder", data,{
  // the color theme used for graphs
  colors: ["#edc240", "#afd8f8", "#cb4b4b", "#4da74d", "#9440ed"],
  xaxis: {
    show: null, // null = auto-detect, true = always, false = never
    position: "bottom", // or "top"
    mode: null, // null or "time"
    font: null, // null (derived from CSS in placeholder) or object like { size: 11, lineHeight: 13, style: "italic", weight: "bold", family: "sans-serif", variant: "small-caps" }
    color: null, // base color, labels, ticks
    tickColor: null, // possibly different color of ticks, e.g. "rgba(0,0,0,0.15)"
    transform: null, // null or f: number -> number to transform axis
    inverseTransform: null, // if transform is set, this should be the inverse function
    min: null, // min. value to show, null means set automatically
    max: null, // max. value to show, null means set automatically
    autoScaleMargin: null, // margin in % to add if autoScale option is on "loose" mode,
    autoScale: "exact", // Available modes: "none", "loose", "exact", "sliding-window"
    windowSize: null, // null or number. This is the size of sliding-window.
    growOnly: null, // grow only, useful for smoother auto-scale, the scales will grow to accomodate data but won't shrink back.
    ticks: null, // either [1, 3] or [[1, "a"], 3] or (fn: axis info -> ticks) or app. number of ticks for auto-ticks
    tickFormatter: null, // fn: number -> string
    showTickLabels: "major", // "none", "endpoints", "major", "all"
    labelWidth: null, // size of tick labels in pixels
    labelHeight: null,
    reserveSpace: null, // whether to reserve space even if axis isn't shown
    tickLength: null, // size in pixels of major tick marks
    showMinorTicks: null, // true = show minor tick marks, false = hide minor tick marks
    showTicks: null, // true = show tick marks, false = hide all tick marks
    gridLines: null, // true = show grid lines, false = hide grid lines
    alignTicksWithAxis: null, // axis number or null for no sync
    tickDecimals: null, // no. of decimals, null means auto
    tickSize: null, // number or [number, "unit"]
    minTickSize: null, // number or [number, "unit"]
    offset: { below: 0, above: 0 }, // the plot drawing offset. this is calculated by the flot.navigate for each axis
    boxPosition: { centerX: 0, centerY: 0 } //position of the axis on the corresponding axis box
  },
  yaxis: {
    autoScaleMargin: 0.02, // margin in % to add if autoScale option is on "loose" mode
    autoScale: "loose", // Available modes: "none", "loose", "exact"
    growOnly: null, // grow only, useful for smoother auto-scale, the scales will grow to accomodate data but won't shrink back.
    position: "left", // or "right"
    showTickLabels: "major", // "none", "endpoints", "major", "all"
    offset: { below: 0, above: 0 }, // the plot drawing offset. this is calculated by the flot.navigate for each axis
    boxPosition: { centerX: 0, centerY: 0 } //position of the axis on the corresponding axis box
  },

  // if you need more than one x axis or y axis
  xaxes: [],
  yaxes: [],

  // customize the data series
  series: {
    points: {
        show: false,
        radius: 3,
        lineWidth: 2, // in pixels
        fill: true,
        fillColor: "#ffffff",
        symbol: 'circle' // or callback
    },
    lines: {
        // we don't put in show: false so we can see
        // whether lines were actively disabled
        lineWidth: 1, // in pixels
        fill: false,
        fillColor: null,
        steps: false
        // Omit 'zero', so we can later default its value to
        // match that of the 'fill' option.
    },
    bars: {
        show: false,
        lineWidth: 2, // in pixels
        // barWidth: number or [number, absolute]
        // when 'absolute' is false, 'number' is relative to the minimum distance between points for the series
        // when 'absolute' is true, 'number' is considered to be in units of the x-axis
        horizontal: false,
        barWidth: 0.8,
        fill: true,
        fillColor: null,
        align: "left", // "left", "right", or "center"
        zero: true
    },
    shadowSize: 3,
    highlightColor: null
  },
  grid: {
    show: true,
    aboveData: false,
    color: "#545454", // primary color used for outline and labels
    backgroundColor: null, // null for transparent, else color
    borderColor: null, // set if different from the grid color
    tickColor: null, // color for the ticks, e.g. "rgba(0,0,0,0.15)"
    margin: 0, // distance from the canvas edge to the grid
    labelMargin: 5, // in pixels
    axisMargin: 8, // in pixels
    borderWidth: 1, // in pixels
    minBorderMargin: null, // in pixels, null means taken from points radius
    markings: null, // array of ranges or fn: axes -> array of ranges
    markingsColor: "#f4f4f4",
    markingsLineWidth: 2,
    // interactive stuff
    clickable: false,
    hoverable: false,
    autoHighlight: true, // highlight in case mouse is near
    mouseActiveRadius: 15 // how far the mouse can be away to activate an item
  },
  interaction: {
    redrawOverlayInterval: 1000 / 60 // time between updates, -1 means in same flow
  },
  hooks: {}
});
Changelog:
v4.2.6 (2023-07-25)
- Update
v4.2.4 (2023-01-21)
- fixes issue with step rendering not connecting last point with line
v4.2.2 (2021-03-17)
- Fixing issue with computing auto-scaled range for horizontal bar series
v4.2.1 (2020-05-07)
- Fixed issue with displaying y-axis endpoint ticks on horizontal bar graphs
v4.2.0 (2020-02-05)
- Update
v4.1.1 (2019-11-22)
- Clearing pie chart hover highlights on mouse leave.
v4.1.0 (2019-11-06)
- Introducing new hook that allows users to extend the default behavior of the findNearbyItems method provided by flot.
v4.0.0 (2019-10-30)
- Creating a new major release as we have introduced a change that necessitates the inclusion of a new script to maintain correct behavior. This will replace the previous patch release from 3.2.11 on. This also has a minor bug fix for fixing a hover issue with bar plots.
v3.2.13 (2019-10-16)
- Fixed issue with inconsistent millisecond values on microsecond dates
v3.2.12 (2019-10-15)
- Minor fix to selection plugin to remove unneeded line.
v3.2.11 (2019-10-15)
- Fixing issue with selection plugin being used with in conjunction with other plugins using drag events, where we couldn't properly disable the selection plugin drag handlers from the drag handlers of a separate plugin.
v3.2.10 (2019-09-25)
- Fixing up a local declaration
v3.2.9 (2019-08-22)
- Make work for both setData and redo plot
v3.2.8 (2019-08-21)
- Fixing Move when reset happens
v3.2.7 (2019-08-09)
- Fixing broken distribution after recent change to hover plugin.
v3.2.5 (2019-08-02)
- Introducing gaps into line rendering of plots when NaNs are encountered in the data.
v3.2.4 (2019-07-30)
- The plugin now catches exceptions thrown from CORS request for style sheets to allow execution to continue. It reports the issue in the console when this happens.
v3.2.3 (2019-07-19)
- Setting selection mode to 'null' will now turn it off.
v3.2.2 (2019-06-29)
- Fix problem where optimizing changes outcome
v3.2.1 (2019-06-27)
- Fix for range snapping to values when axis autoScale set to 'loose' even when there is no data
v3.2.0 (2019-06-19)
- Reverting change for loading CORS stylesheets.
- Various bug fixes.
v3.1.1 (2019-06-14)
- Fixing issue on Safari with loading cross domain style sheets.
v3.1.0 (2019-05-31)
- Introducing a second event for when drawing is done that originates from placeHolder.
- Fix issue with style sheets not working when in a cross domain context.
- Fix issue with Math.pow() introduced by new version of Chrome.
v3.0.0 (2019-04-03)
- Fix memory leak in hover plugin.
v3.0.0 (2019-03-23)
- CHANGE: Setting pan: { enableTouch: true } will no longer automatically turn on pinch gestures for touch support. Pinch gestures are now turned on by setting zoom: { enableTouch: true }. The recentering double-click (or tap) mechanism can now be optionally turned off. Finally, we have provided an option to allow events to propagate for gestures that are handled by the navigate plugins, regardless of whether they are enabled or not.
v2.3.2 (2019-03-22)
- Fixing issue with extending the Date class causing problems with babel.
v2.3.1 (2019-03-21)
- Adding microseconds as option for timeBase setting for axis. Various bug fixes.
- Fix error when using hover plugin from minified source.
v2.2.1 (2019-03-05)
- Added new pan modes for mouse and touch interactions.
v2.2.0 (2019-02-27)
- Added new pan modes for mouse and touch interactions.
- Fixed issue with empty string tick label being replaced by auto-generated label.
- Fixed issue with hovering over bars no longer working.
- Fixed tracking example to update legend again.
- Fixed issue with tooltips not being correct for stacked graphs.
v2.1.6 (2019-02-12)
- update to the latest version.
This awesome jQuery plugin is developed by flot. For more Advanced Usages, please check the demo page or visit the official website.
