Canvas Based Plotting Plugin With jQuery And D3.js - CanvasPlot
| File Size: | 12.9 KB |
|---|---|
| Views Total: | 1260 |
| Last Update: | |
| Publish Date: | |
| Official Website: | Go to website |
| License: | MIT |
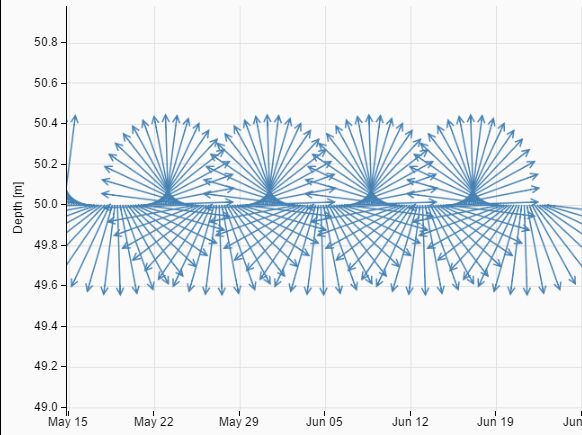
CanvasPlot is a powerful, interactive JavaScript plotting library which allows to visualize your large data sets using jQuery, D3.js and Html5 canvas element.
How to use it:
1. Load the required jQuery and D3.js libraries in your html document.
<script src="/path/to/jquery.min.js"></script>
<script src="/path/to/d3.min.js"></script>
2. Load the CanvasPlot's JavaScript and Style sheet in the document.
<div id="Container">
</div>
3. Prepare your data in the JavaScript.
var myData = [[-1,5], [0.5,6], [5,-2.5], [6,1], [10,9], [20,-55]];
4. Create a new CanvasDataPlot object with options. Supported plot types:
- Scatter Plot: CanvasDataPlot(parentElement, canvasDimensions, config)
- Time Series Plot: CanvasTimeSeriesPlot(parentElement, canvasDimensions, config)
- Vector Time Series Plot: CanvasVectorSeriesPlot(parentElement, canvasDimensions, config)
- Plot Groups: CanvasDataPlotGroup(parentElement, canvasDimensions, config)
var myPlot = new CanvasDataPlot(d3.select("#maincontainer"), [1000, 900], {
    xAxisLabel: "IQ",
    yAxisLabel: "Test Score",
    markerLineWidth: 3,
    markerRadius: 5
});
5. All default configuration options.
plotLineWidth: 1,
maxInformationDensity: 2.0,
showMarkerDensity: 0.14,
gridColor: "#DFDFDF",
markerLineWidth: 1,
markerRadius: 3.0,
xTicksPerPixel: 1.0/92.0,
yTicksPerPixel: 1.0/40.0,
minCanvasWidth: 250,
minCanvasHeight: 150,
legendMargin: 10,
legendXPadding: 5,
legendYPadding: 6,
legendLineHeight: 11,
plotMargins: {
  top: 20,
  right: 20,
  bottom: 30,
  left: 65
},
showTooltips: true,
tooltipRadius: 5.5,
xAxisLabel: "",
yAxisLabel: "",
updateViewCallback: null,
6. API methods.
var myPlot = new CanvasDataPlot(d3.select("#maincontainer"), [1000, 900], {
    // options here
});

myPlot.
addDataSet(uniqueID, label, dataSet, colorString, updateDomains, copyData);
addDataPoint(uniqueID, dataPoint, updateDomains, copyData);
removeDataSet(uniqueID);
setZoomXAxis(zoomX);
setZoomYAxis(zoomY);
resize(dimensions);
updateDomains(xDomain, yDomain, makeItNice);
getXDomain();
getYDomain();
calculateXDomain();
calculateYDomain();
destroy();
This awesome jQuery plugin is developed by a-johanson. For more Advanced Usages, please check the demo page or visit the official website.


