Free jQuery heatmap Plugins
All the Free jQuery Plugins about 'heatmap' are listed here.
9 Best Github Style Calendar Heatmap Plugins In JavaScript (2024 Update)
- jQuery Script Blog - 4232 ViewsCheck out these 9 best and open-source JavaScript plugins to create Github-style calendar heatmaps for your next project.
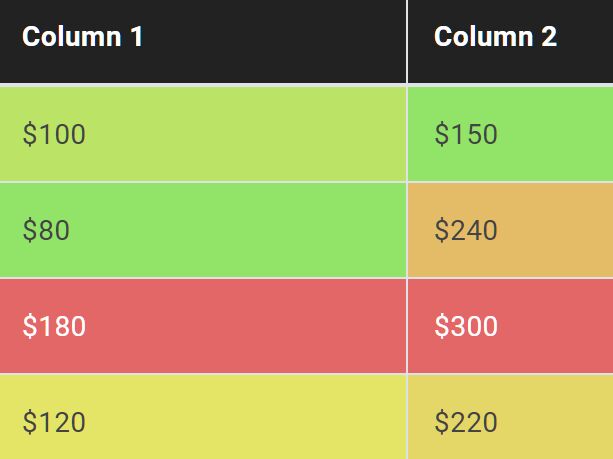
Colorize Numeric Values In Table Columns - Column HeatMap
- Table - 1724 ViewsA jQuery plugin to make your data table more readable by applying different background colors to table cells based on values in specific columns.
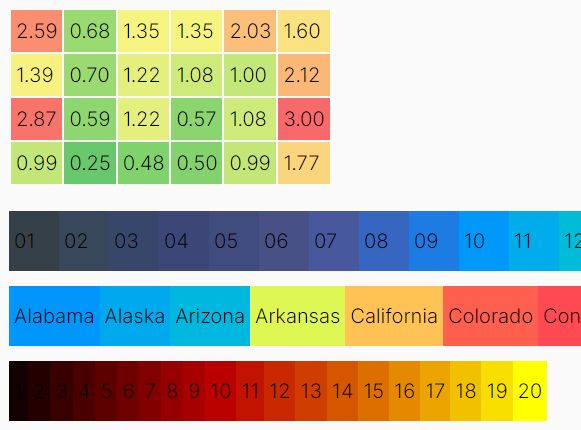
Create Heatmaps From Numerical Values In HTML Elements - jQuery Hottie
- Chart & Graph - 808 ViewsA jQuery heatmap plugin for formatting HTML elements (like table cells and list items) with a range of colors based on the calculated value of numerical data.
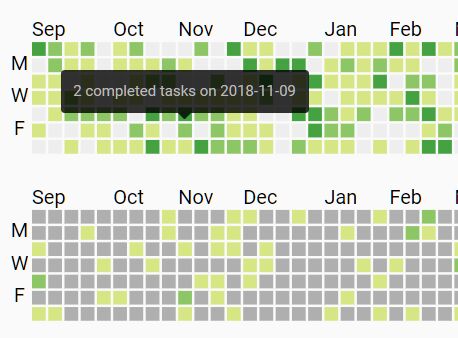
Calendar Heatmap Plugin With jQuery And Moment.js - CalendarHeatmap
- Chart & Graph - 15166 ViewsCalendarHeatmap.js is a jQuery plugin used to generate a dynamic, interactive, configurable calendar heatmap for representing time series data.
Github Style Calendar Heatmap In jQuery
- Chart & Graph - 4107 ViewsJust another jQuery plugin that dynamically renders a calendar heatmap (year view) to visualize time series data (like activities, contribution) similar to Github contribution graph.

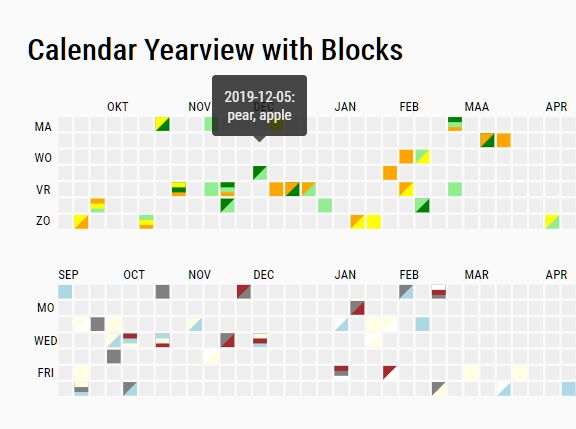
Dynamic Flat Block Chart Plugin With jQuery - TimelineHeatmap
- Chart & Graph - 3460 ViewsThe Flat Block Chart Plugin dynamically generates a horizontal timeline-style heat map where the individual values contained in a 3D or 2D matrix are represented as flat clickable blocks.
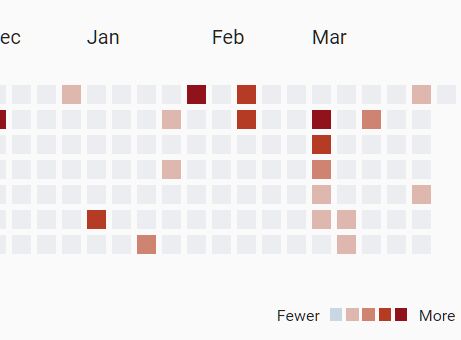
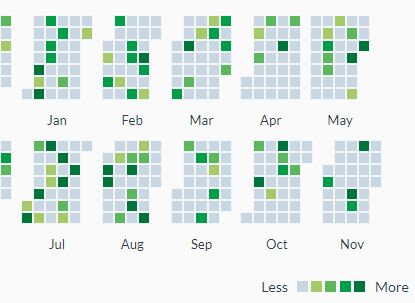
Github Style Heatmap Graph Plugin With jQuery - Calmosaic
- Chart & Graph - 2817 ViewsCalmosaic (Calendar Mosaic) is a jQuery plugin that dynamically renders a customizable calendar heatmap for representing time series data. Inspired by Github's contribution chart.
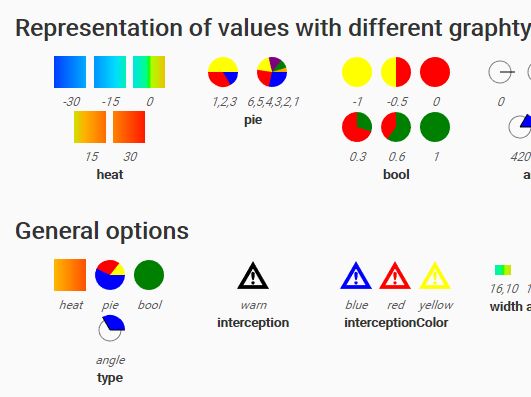
Sparkline (Inline Chart) Plugin With jQuery And SVG - inlineGraph
- Chart & Graph - 3793 ViewsinlineGraph is a lightweight and simple-to-use jQuery plugin used for generating SVG based inline graphs and charts (aka. sparklines) to present your data as heatmap, pie, boolean and angle.
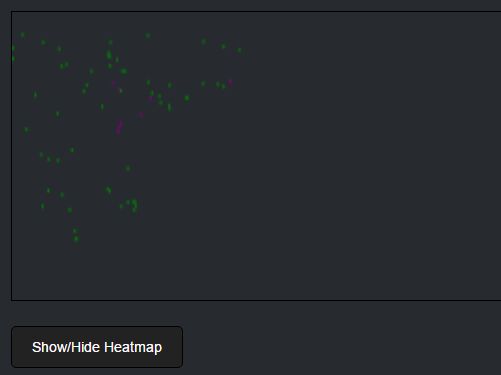
Click Heat Map Generator With jQuery And Canvas - Heatmap.js
- Chart & Graph - 2380 ViewsA jQuery plugin that lets you generate a click heat map on an HTML5 canvas element to visualize where your visitors left or right click on the web content.