Dynamic Flat Block Chart Plugin With jQuery - TimelineHeatmap
| File Size: | 45 KB |
|---|---|
| Views Total: | 3549 |
| Last Update: | |
| Publish Date: | |
| Official Website: | Go to website |
| License: | MIT |

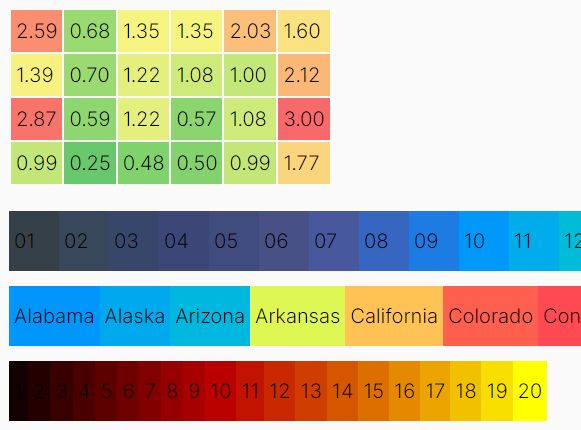
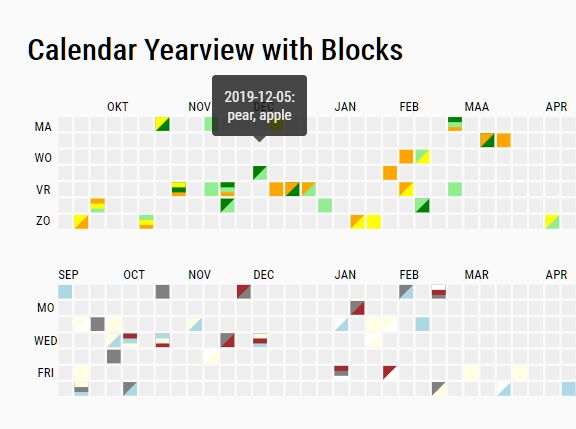
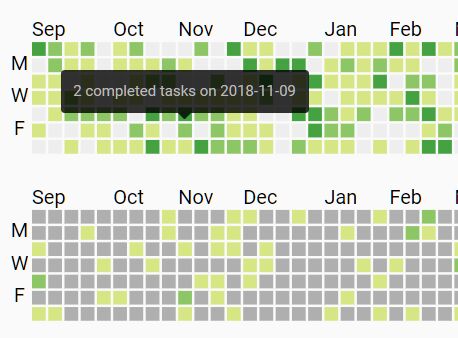
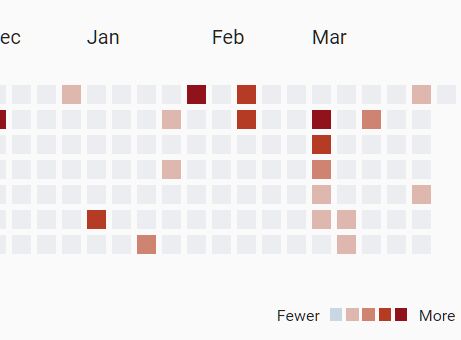
The Flat Block Chart Plugin dynamically generates a horizontal timeline-style heat map where the individual values contained in a 3D or 2D matrix are represented as flat clickable blocks.
Basic usage:
1. Import jQuery library and the jQuery TimelineHeatmap plugin into the page.
<link href="TimelineHeatmap.css" rel="stylesheet">
<script src="https://code.jquery.com/jquery-3.3.1.min.js"
        integrity="sha384-tsQFqpEReu7ZLhBV2VZlAu7zcOV+rXbYlF2cqB8txI/8aZajjp4Bqd+V6D5IgvKT"
        crossorigin="anonymous"></script>
<script src="TimelineHeatmap.js"></script>
2. Prepare your data in a 3D or 2D matrix as follows:
mydata = [
  [
    [
      "Mar 01",
      1,
      56,
      "03/01/2018"
    ],
    [
      "Mar 02",
      3,
      1,
      "03/02/2018"
    ],
    [
      "Mar 03",
      4,
      67,
      "03/03/2018"
    ]
    // ...
  ]
]
3. Generate a basic heat map in a container you specify.
<div id="myHeatmap"></div>
myHeatmap = new edaplotjs.TimelineHeatmap('myHeatmap', {
  data: myData,
  columnNames: ["label", "color", "height", "custom_field"]
});
4. More configuration options to customize the heat map.
myHeatmap = new edaplotjs.TimelineHeatmap('myHeatmap', {

  data: myData,
  columnNames: ["label", "color", "height", "custom_field"],

  // The column index in the data matrix for showing labels under each block
  dataIndexForLabels: 0,

  // The column index in the data matrix for coding the color of each block
  dataIndexForColors: 1,

  // The column index in the data matrix for coding the height of each block
  dataIndexForHeights: 2,

  // Enable rendering each block by color quatiles
  // Default: false
  useColorQuantiles: true,

  // The bin and range of the color
  colorBin: [],
  colorRange: [],

  // The bin and range of the height
  heightBin: [],
  heightRange: [],

  // Prevent adding events to blocks with color value zero
  noEventWhenColorValueZero: true,

  // Add an arrow on the left of the timeline for appending new data.
  // If this setting is a function, when the arrow is clicked, the function will be triggered.
  addLeftArrow: true,

  // The text on the bottom of the arrow
  leftArrowLabel: 'More',

  // Indicate if the chart needs to be plotted when the object is created.
  plotDataWhenCreated: true

});
5. Callback functions.
myHeatmap = new edaplotjs.TimelineHeatmap('myHeatmap', {

  click: function ($e, obj) {
    console.log("click", $e.data(), obj);
  },

  select: function ($e, obj) {
    console.log("select", $e.data(), obj);
  },

  create: function (obj) {
    console.log("create", obj);
  };

});
6. API methods.
// clear block selection
myHeatmap.clearBlockSelection();

// select a specified block
myHeatmap.selectBlockByIndex(5);

// Select the last block
myHeatmap.selectLastBlock();

// Select the first block
myHeatmap.selectFirstBlock();

// Prepend blocks to the left of the timeline.
var data = [["Mar 03", 9, 2, "03/03/2018"], ["Mar 04", 14, 2, "03/04/2018"]];
myHeatmap.prependBlocks(data);

// Update blocks
var data = [["Mar 03", 9, 2, "03/03/2018"], ["Mar 04", 14, 2, "03/04/2018"]];
myHeatmap.updateBlocks(data);

// Get the data of the current selected block.
myHeatmap.getSelectedBlockData();

// Get the jQuery DOM element of the current selected block.
myHeatmap.getSelectedBlock();

// Get the current number of blocks.
myHeatmap.getNumberOfBlocks();

// Use index to get the data for the corresponding block.
myHeatmap.getBlockDataByIndex(index);

// Get the data for the first block
myHeatmap.getFirstBlockData();

// Get the data for the last block
myHeatmap.getLastBlockData();

// Hide the left arrow
myHeatmap.hideLeftArrow();

// Show the left arrow
myHeatmap.showLeftArrow();

// Set the opacity of the left arrow
myHeatmap.setLeftArrowOpacity(0.5);

// Disable the left arrow
myHeatmap.disableLeftArrow();

// Enable the left arrow
myHeatmap.enableLeftArrow();
Changelog:
2019-12-17
- Remove the parameter create when initializing the chart.
- Add a new flag, plot_data_when_created, to control if the data need to be plotted when the object is created.
2018-11-14
- Handled edge cases when there is no data.
2018-11-06
- Added a parameter for disabling the color of selected blocks.
This awesome jQuery plugin is developed by yenchiah. For more Advanced Usages, please check the demo page or visit the official website.